ITDP India

Promoting sustainable and equitable transportation worldwide

  • Contact
  • ITDP India’s 2025
  • Who We Are
    • Our Approach
    • Contact Us
    • Career Opportunities
  • What We Do
    • Healthy Streets
    • Public Transport
    • Electric Mobility
    • Transit Oriented Development
    • Low Emission Zones
    • Inclusive Mobility
    • Traffic Reduction
  • Where We Work
    • NATIONAL
    • MAHARASHTRA
      • Pune
      • Pimpri Chinchwad
      • Nashik
    • TAMIL NADU
      • Chennai
      • Coimbatore
    • JHARKHAND
      • Ranchi
    • Agra
    • Ahmedabad
  • Blogs
  • Resources
    • Press
  • National Challenges
    • India Cycles4Change Challenge
    • Streets for People Challenge
    • Transport4All Challenge
  • Urbanlogue
    • Urbanlogue Webinars – Series One
    • Urbanlogue Webinars – Series Two
    • Urbanlogue Webinars – Series Three
    • Urbanlogue Webinars – Series Four

Bridging the Gaps: Towards Climate – Inclusive Urban Mobility Planning in Thoothukudi

22nd April 2026 by admin

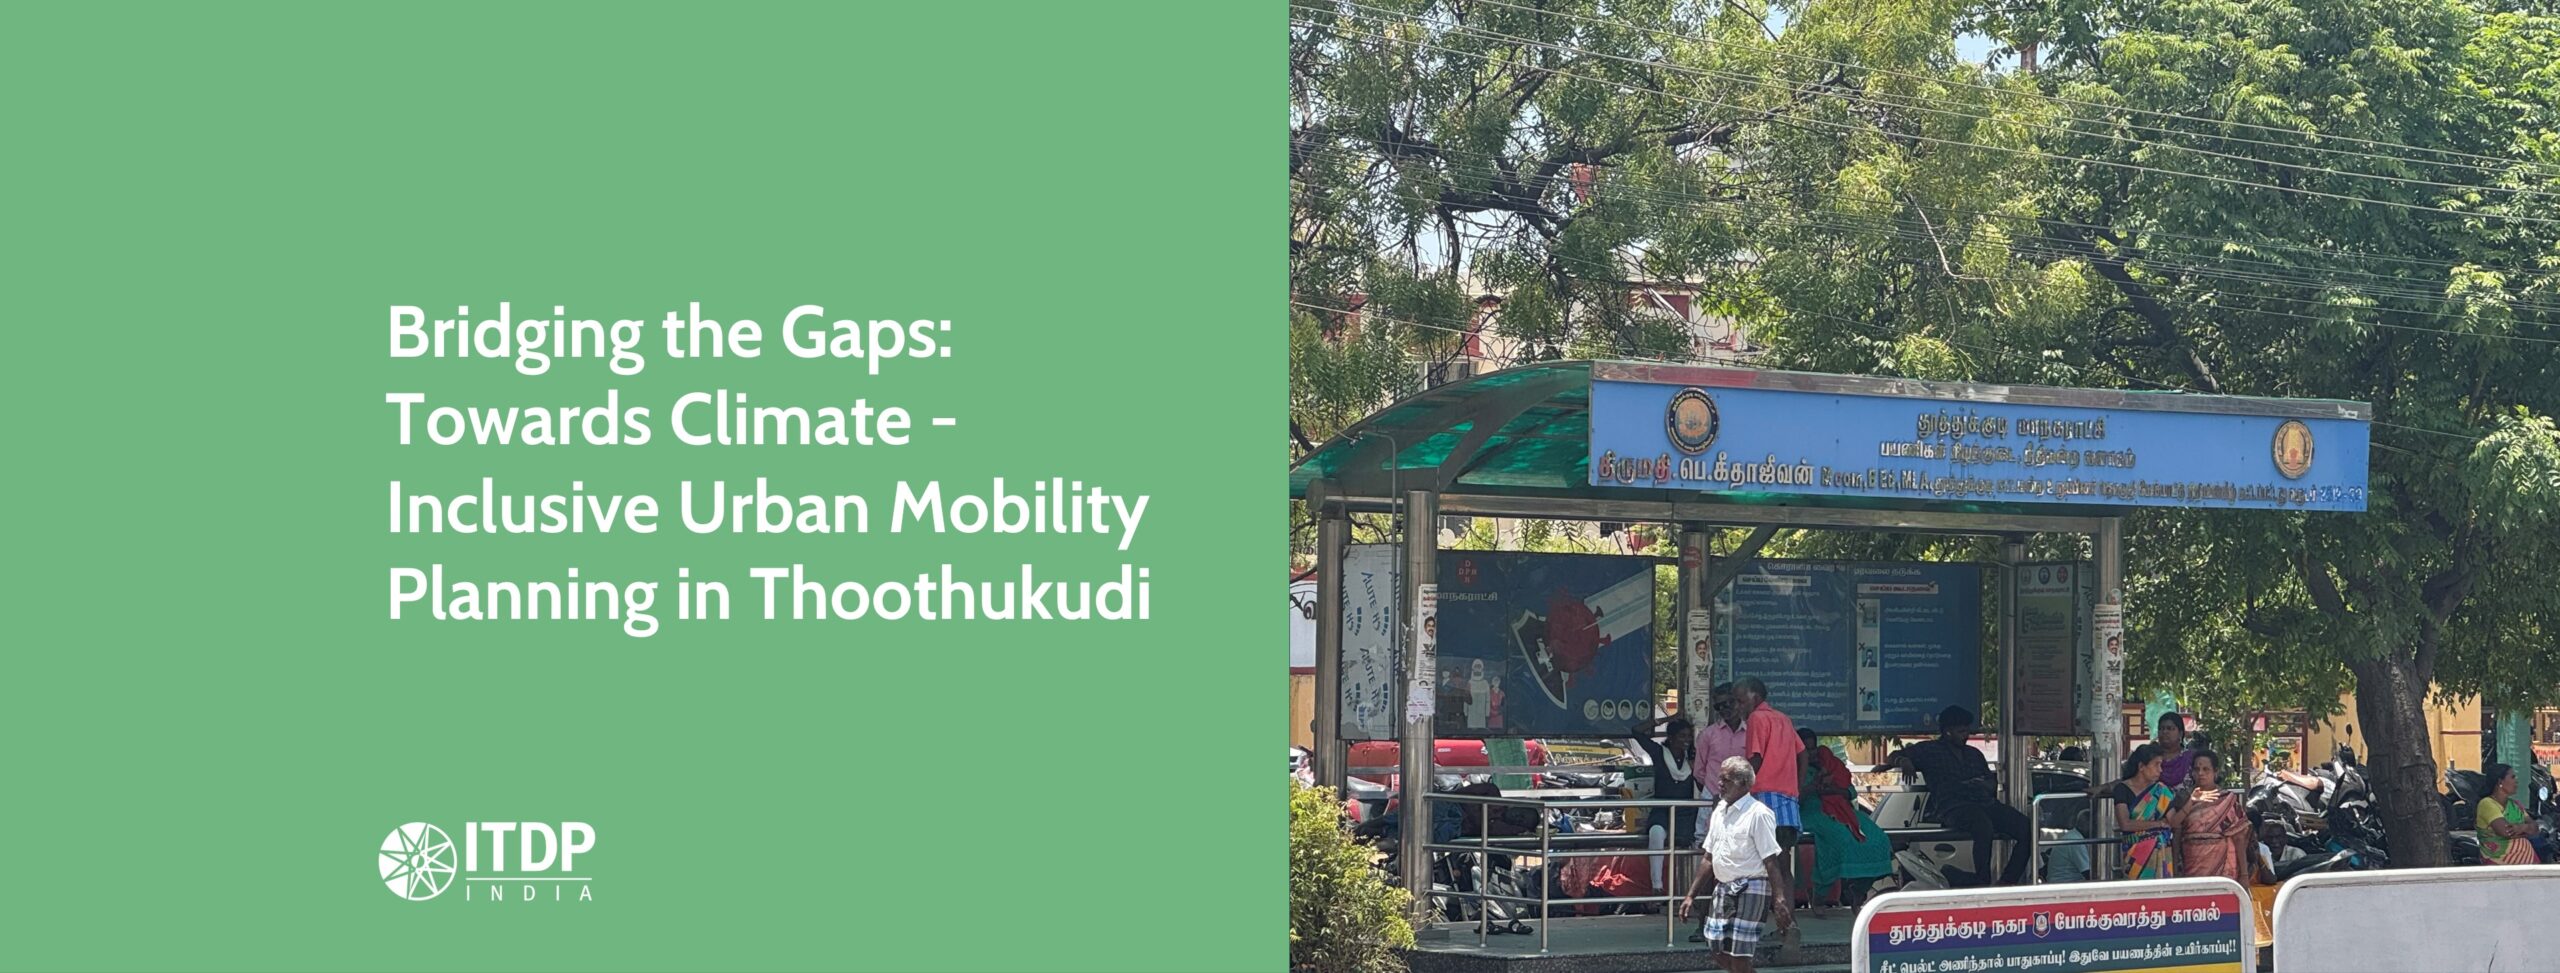
Introduction: A Port City at a Mobility Crossroads 

Thoothukudi, also known as Tuticorin, stands at a pivotal stage in its urban mobility planning and economic development trajectory. As one of Southern India’s most important maritime hubs, the city’s growth is anchored by the V.O. Chidambaranar (VOC) Port. It is Tamil Nadu’s second largest port and the country’s third largest container terminal. Positioned as a rapidly expanding Tier II port and industrial centre, Thoothukudi plays a strategic role in enabling regional and national trade flows. Its economy is shaped by a diverse set of drivers, including shipping and logistics, energy production, salt manufacturing, and marine-based livelihoods. Thoothukudi contributes 70% of Tamil Nadu’s total salt production and meets nearly 30% of India’s salt requirements, underscoring its national significance. Industrial activity is robust, with approximately 736, operational factories, 377 of which lie within the municipal limits. Collectively, these economic forces have spurred steady population growth, urban expansion, and escalating travel demand, positioning Thoothukudi as an emerging economic and logistics powerhouse in Tamil Nadu. 

However, the city’s rapid economic expansion has simultaneously intensified pressures on its transportinfrastructure. Between 2022 and 2025, the number of registered vehicles in Thoothukudi increased by nearly 18% reflecting a growing dependence on private motorised transport. Rising vehicle ownership and growing congestion are straining mobility systems, while persistent safety challenges continue to affect pedestrians and cyclists. A total of 165 road accidents (Source: District Crime Record Bureau, Traffic Police, Thoothukudi) were recorded between 2023 and 2025 highlighting road safety issues. In addition, increasing exposure to climate risks such as flooding, heat stress, and cyclonic disturbances is further reshaping mobility patterns across Thoothukudi. Nearly 30% of the composite local planning area (CLPA) is vulnerable to flooding. These trends reinforce both climate and safety-related concerns. 

Strengthening integrated urban mobility and planning in Thoothukudi is about building a system that is safe, inclusive, reliable, and resilient to climate risks; one that supports both people’s daily commuting needs and the city’s long-term growth. This technical blog draws from a comprehensive Gap Assessment and Stakeholder Consultation study undertaken as part of the UK-PACT (Partnering for Accelerated Climate Transitions) programme in Thoothukudi. It examines the current urban mobility planning landscape in Thoothukudi and discusses how targeted, climate-inclusive interventions can strengthen existing systems and position the city as a model for sustainable urban mobility planning in Tier-II Indian cities.  

Why Urban Mobility Planning and Climate Must Be Planned Together 

Urban mobility planning in Thoothukudi reflects the broader challenges confronting many rapidly expanding Indian cities. While economic activities intensify and the urban footprint continues to grow, transport infrastructure and governance framework often struggle to keep pace. As of December 2025, Thoothukudi had 3.6 lakhs registered vehicles, with over 79% being two-wheelers, followed by 11% cars and 6% commercial vehicles, reflecting a strong reliance on two-wheelers. 

Public buses (41 TNSTC and 58 private operators are operating) continue to serve as the primary mode of mass transport; however, issues related to service quality, network coverage, and first and last mile connectivity persist. Currently, 37% of daily commuters rely on buses, yet nearly 51% depend on motorised modes for their first and last mile, highlighting significant gaps in non-motorised and shared mobility options. 

At the same time, climate risks are becoming increasingly visible in travel patterns. Flooding during heavy rainfall disrupts road networks, heat stress reduces walkability, and cyclonic events threaten the reliability of transport services. Survey findings show that more than one-third of commuters experience weather-related travel disruptions, while over a quarter report skipping or cancelling trips during extreme conditions, resulting in economic losses and reduced access to livelihoods. 

These patterns highlight a critical insight: urban mobility planning that ignores climate resilience and social inclusion risks locking cities into high-cost, high-carbon, and inequitable pathways. 

Methodological Approach: A Multi-Layered Gap Assessment 

The Thoothukudi gap assessment adopted a structured, evidence-based methodology that combines three complementary lenses. 

First, a policy and plan review was conducted using a SWOT-based framework to assess how existing statutory and non-statutory documents align with climate-inclusive mobility principles. Key documents reviewed include,  

  • Comprehensive Mobility Plan (2014) 
  • Draft GIS-Based Master Plan (2041)
  • Tamil Nadu Electric Vehicle Policy (2023)  
  • Tamil Nadu Climate Change Mission (2022) 
  • Port Master Plan (2014) 
  • Tamil Nadu Logistics Policy and Integrated Logistics Plans (2023)

alongside Smart Cities Mission and relevant industrial development strategies. 

Second, structured stakeholder consultations were conducted with key agencies responsible for shaping mobility in Thoothukudi—spanning municipal departments, planning authorities, transport operators, and enforcement bodies. Key stakeholders engaged include,  

  • Thoothukudi City Municipal Corporation (Engineering, Town Planning, Accounts, and ICCC departments) 
  • Local Planning Authority, Thoothukudi 
  • Directorate of Town and Country Planning (DTCP) 
  • Tamil Nadu State Transport Corporation (TNSTC)  
  • Regional Transport Office (RTO) 
  • Traffic Police  

These discussions assessed governance structures, inter-agency coordination, budgeting systems, infrastructure execution practices, regulatory frameworks, data limitations and climate considerations influencing urban mobility in the city.  

Third, a commuter perception survey captured covering approximately 800 respondents across 13 strategically selected locations within the Thoothukudi City Municipal Corporation (TCMC) boundary. The survey providedgranular insights into travel behaviour, accessibility, affordability, safety, inclusion, and climate-related disruptions. Together, these layers enabled a comprehensive understanding of systemic gaps as well as on-ground realities.  

Policy and Institutional Gaps: Fragmentation at the Core 

One of the most significant findings of the assessment relates to institutional and policy fragmentation. While Thoothukudi has multiple plans and sectoral policies in place, they address mobility, climate action, land use,freight and economic development largely in silos. 

Public transport strengthening, non-motorised transport (NMT), electric mobility, freight movement, and climate mitigation appear across different documents, but without a unified implementation framework or clear alignment with city-level climate targets. Transport-sector greenhouse gas baselines, mitigation indicators, and monitoring mechanisms are inconsistently embedded within statutory plans, limiting the city’s ability to track progress toward low-carbon mobility goals. 

Stakeholders further highlighted that inter-departmental coordination is predominantly ad hoc and project specific. While the city has demonstrated capacity to deliver large infrastructure projects through national and state schemes, mobility initiatives remain largely scheme-driven rather than guided by a long-term, integrated strategyand vision for the city.  

Understanding Mobility Patterns: What the Data Reveals 

Data from the commuter perception survey and secondary analysis reveal a nuanced picture of mobility in Thoothukudi. 

Public buses account for approximately 37% of daily trips, while two-wheelers contribute around 32%.Walking and cycling together represent a significant 14% share-indicating strong latent demand for NMT that remainsunderserved due to inadequate infrastructure. Work trips dominate travel demand, accounting for nearly 60% of all journeys, followed by education and shopping trips which each constitute 17% of the total trips. 

Gender-disaggregated data highlights important equity dimensions.  Men predominantly rely on two-wheelers (50.6%) and buses (28.9%), whereas women show a higher dependence on buses (52.9%) and NMT (bicycle and walk) (21%). This highlights the need for safe, accessible, and affordable public transport and NMT systems to support women’s mobility and enable their full participation in the urban economy. 

Figure 1: Mode of Commute – Gender Aggregated Preferences. Source: TERI 

Understanding Mobility Patterns: What the Data On-Ground Challenges: Accessibility, Safety, and Affordability  

Despite relatively high public transport usage, commuters face multiple barriers across the travel chain. More than half of respondents rely on motorised modes for first and last-mile access, while 15% report that bus stops are located over a radius of more than one kilometre from their homes. Average waiting time for buses stand at around 16 minutes, reducing reliability for daily commuters. 

Safety and inclusivity concerns are particularly acute. Nearly 70% of respondents cited poor pedestrian facilities, including the absence of safe crossings, signages, and continuous footpaths. Only 15 bus shelters meet universal accessibility standards, and inadequate street lighting affects night-time safety-especially for women, elderly persons, and persons with disabilities. 

In this regard, discussions with stakeholders revealed a shared concern: while the intent to create safer and more inclusive streets exists, translating it into on-ground design remains a challenge. Limited technical capacity impedes efforts to map climate-vulnerable stretches, address missing road links, and develop a coherent NMT network for the city. There is a strong need for targeted design and planning support particularly for creating universally accessible footpaths with tactile paving and appropriate signages, and for integrating pedestrian safety measures such as pelican crossings and signalised intersections. Strengthening technical capacity and institutionalising these measures is critical to delivering safer, more inclusive, and climate-responsive streets for all. 

Affordability also remains a critical issue, around one-third of commuters spend 10 -20% of their income on travel.  One in four avoid trips altogether due to high transport costs. Additionally, low digital adoption-reflected in the limited willingness to use app-based mobility systems highlights the need for inclusive, accessible service models. 

Figure 2: Commuter Perceptions – SWOT. Source: TERI 

The commuter perception survey highlights that systematic barrier that limits walkability in the city. Many people are reluctant to walk due to safety concerns arising from poor street lighting, high traffic volumes, and encroached or discontinuous footpaths. They expressed a clear need for continuous, well-connected pedestrian infrastructure and frequent, reliable public transport services, underscoring the importance of strengthening both walkability and service quality to improve everyday mobility. 

Climate Risk and Mobility: Exposure and Vulnerability 

Climate risk analysis reveals that existing mobility systems in Thoothukudi lack resilience to extreme weather events. Several neighbourhoods, including Matha Koil and Muthu Nagar function as “triple hazard zones,” where recurrent urban flooding, intense heat stress, and cyclonic impacts converge to disrupt travel and transport operations. 

These climate stresses disproportionately affect vulnerable populations who depend on walking, cycling, and public transport for daily mobility. During extreme events, disruptions to transport networks translate directly into lost incomes, reduced access to essential services, and elevated safety risks particularly for women, informal workers, the elderly, and persons with disabilities. In the absence of systematic climate vulnerability mapping and its integration into transport planning, infrastructure design, and service operations, these impacts are likely to intensify in both frequency and severity over the coming decades. 

Strategic Pathways: From Gaps to Action 

The gap assessment points toward a set of interlinked strategic priorities for building climate-inclusive mobility in Thoothukudi. 

Figure 3: Strategic Priorities – Towards Climate Inclusive Mobility. Source: ITDP India 

  • Dedicated Urban Mobility Unit: At the institutional level, establishing a dedicated Urban Mobility Unit within the Municipal Corporation can provide a focal point for coordinated planning, budgeting, and monitoring across agencies. Leveraging existing statutory mechanisms, such as the District Road Safety Committee, can further support integrated decision-making without creating parallel structures. 

Implication: Stronger governance structures will move the city from project-based execution to long-term, system-level planning.  

  • NMT and Public Transport Infrastructure Strengthening NMT and public transport infrastructure emerges as a high-impact intervention. City-wide NMT and Complete Streets network planning, universally accessible bus shelters, and improved feeder integration can drive mode shift away from private vehicles while enhancing resilience during extreme weather events. 

Implication: Investments in public and non-motorised transport deliver high returns—improving equity, safety, overall system efficiency and revenue gains through improved businesses and real estate.  

  • Climate-Responsive Infrastructure Embedding climate-responsive design principles- including flood- and heat-sensitive infrastructure, shaded walkways, and route-level vulnerability mapping-can reduce service disruptions and long-term maintenance costs. A phased electric mobility roadmap, starting with public and para-transit fleets, offers opportunities to reduce tailpipe emissions and improve urban air quality. 

Implication: Climate-responsive infrastructure reduces long-term costs while strengthening resilience and service continuity. 

  • Dedicated Financing: Equally important is the creation of predictable, ring-fenced financing for mobility infrastructure, supported by climate finance, multilateral funding, and CSR partnerships. Strengthening data systems and linking mobility indicators to the city’s Integrated Command and Control Centre (ICCC) can enable evidence-based planning and performance monitoring. 

Implication: Moving away from ad-hoc/one-time, scheme-based funding ensures continuity and scalability of mobility investments. 

Thoothukudi – A Lighthouse Opportunity for Tier-II Cities 

Thoothukudi’s urbanisation trajectory reflects a broader shift underway across India’s Tier-II cities. As cities like Coimbatore, Madurai, Surat, Nagpur, and Visakhapatnam expand, mobility systems are under increasing pressure to evolve often outpacing the capacity of existing planning and governance frameworks. These challenges are systemic, interconnected and shape how people experience their city every day whether urban mobility and planning feel safe, accessible, and dependable. 

Within this context, Thoothukudi presents a critical opportunity. As a mid-sized, fast-growing port city, it offers the right scale to test solutions that are practical, adaptable, and grounded in local realities. Strengthening public transport, improving last-mile connectivity, prioritising walking and cycling, and embedding climate resilience into infrastructure can collectively move the city towards a more balanced and future-ready mobility system. Therecommendations emerging from the gap assessment and stakeholder consultation study sets a strong foundationto guide and enable this transition. 

Aligning Local Action with State Ambition 

Playing a catalytic role, the gap assessment and stakeholder consultations, has helped build a robust evidence base, deepen institutional understanding, and identify priority actions towards climate-inclusive urban mobilityplanning. By supporting data-driven analysis and fostering cross-sectoral collaboration, the UK-PACT programme is accelerating early wins while demonstrating how targeted technical assistance can unlock scalable and replicable urban transformations. 

It also aligns with Tamil Nadu’s broader development vision. The state has consistently positioned itself as a leader in sustainable urbanisation, climate action, and inclusive economic growth; Tamil Nadu has committed to achieving net-zero emissions well before 2070, supported by dedicated institutions like the Tamil Nadu Climate Change Mission and targeted climate financing. At the same time, it is strengthening data-driven planning through state-level climate-tracking systems that help guide policy and monitor progress.

On the mobility front, the state is emerging as a major hub for electric mobility. It already accounts for a significant share of India’s EV manufacturing and continues to attract large-scale investments in the sector. Alongside this, investments in urban infrastructure across Tier-II cities and district-level decarbonisation efforts are also beginning to integrate mobility, energy, and resilience planning. Together, these efforts signal a clear direction: building cities that are not only economically competitive, but also low-carbon, inclusive, and resilient. 

By advancing climate-inclusive and people-centric mobility through the programme, Thoothukudi can directly contribute to these state-level goals. It can support lower emissions, improve air quality, enhance accessibility for all groups, and strengthen resilience to climate risks—while continuing to drive economic growth through its port and industrial base. Thoothukudi can emerge as a true lighthouse city—demonstrating how Tier-II cities can move beyond fragmented improvements and align mobility, climate, and equity goals within a coherent and scalable framework. 

Authors

Varsha Vasuhe V, Senior Associate, ITDP India  

Sharif Qamar, Fellow & Associate Director, TERI 

Ruchika Mattoo, Associate Fellow, TERI  

Richa Joshi, Senior Manager, MInT, IIT Madras 

Reviewed by Sooraj EM, Program Manager, ITDP India

Technical support by

Priya Dharshini, Research Associate, ITDP India

Anushree Harde, TERI

Arun Babu, TERI

Filed Under: Public transport Tagged With: climate inclusive transport India, climate resilient cities India, EV policy Tamil Nadu, non motorised transport India, public transport challenges India, sustainable urban mobility planning, Thoothukudi urban mobility, Tier II city transport planning, Tuticorin transport infrastructure, urban mobility gaps analysis

Why Liveable Cities, Not Flyovers, Will Win Urban Votes

8th April 2026 by admin


As published in The Hindu(Tamil)

For decades now, the opening of a new flyover has been the ultimate symbol of political progress. These towering structures of concrete and steel were marketed as the ultimate solution to congestion and a promise of modernity and speed.  

But ask any commuter on any major artery in our cities, and the answer is clear: the promise has expired. The congestion returns, often worse than before, while the immense investment delivers only fleeting relief for a small segment of commuters. 

The larger public sees very little benefit. 

The core problem here lies in an old belief in city planning: that we can build our way out of traffic. In reality, new roads encourage more people to use private vehicles. When driving becomes slightly easier, more cars and two-wheelers come onto the road. Soon, congestion returns. This cycle keeps repeating and cities keep spending huge public money on projects that are both environmentally and fiscally unsustainable.  

Globally, most forward-thinking cities have begun to question this approach. One famous example is Seoul in South Korea. The city famously dismantled a massive elevated highway through its centre, over the Cheonggyecheon stream. Many feared traffic chaos. Instead, Seoul gained a six-kilometre public park, better air quality, a 15% increase in public transport use, and rising property values. Traffic did not increase. The city became healthier and more liveable. 

San Francisco, Portland, and Paris have followed suit, removing urban highways to reclaim space for people, not just vehicles. These cities recognised that the competition for the future isn’t about which city is fastest to drive through, but which is the most desirable to live in. 

So, what is the political alternative in Tamil Nadu? It’s a platform that addresses the actual anxieties of the 21st-century voter: the crushing cost of living, the daily drain of the time-tax commute, and the health burden of toxic air. 

1. Fiscal Responsibility: Better Use of Public Money 

Flyovers are extremely expensive. One kilometre of flyover can cost ₹200 crore or more. This money serves a limited number of private vehicles. In contrast, the same amount can fund solutions that help far more people. 

For example, well-planned Bus Rapid Transit (BRT) corridors can move seven to eight times more people per hour than a flyover. The same budget can also buy around 100 electric buses or build over 100 kilometres of safe footpaths and pedestrian-friendly streets. 

The real question for governments should be: how can public money help the maximum number of people? Flyovers benefit a minority. Strong public transport systems benefit everyone—office workers, students, elderly citizens, women, and low-income families. From a financial point of view, investing in buses, walking, and cycling gives far better returns for taxpayers. 

2. The Daily “Time Tax” on Citizens 

For city residents, time has become a hidden tax. Hours are lost every week in traffic jams. This affects work, family life, health, and mental well-being. For professionals, small business owners, and gig workers, time lost is income lost. 

A city with frequent, reliable buses and good last-mile connectivity gives people back their time. Shorter and predictable commutes improve productivity and reduce stress. Today, many employees value an easy commute as much as salary hikes. Real estate prices already show this—areas close to good public transport are in high demand. 

When governments invest in strong public transport, they are not just improving mobility. They are strengthening the economy. Reduced travel time means more efficient cities and happier citizens. 

3. Public Health and Quality of Life 

Our cities are struggling with pollution, noise, and unsafe streets. Transport is one of the biggest contributors to air pollution and climate emissions. Every new flyover encourages more vehicle use, which worsens air quality. 

The alternative is cities designed for people. Safe footpaths, cycle tracks, shaded streets, and green spaces make cities healthier. These changes reduce respiratory illness, traffic accidents, and stress. Children can walk safely. Elderly citizens can move around without fear. Neighbourhoods become connected instead of divided by large concrete structures. 

This is not a luxury idea. It is about basic health, safety, and dignity in everyday life. 

What Voters Want Today

The voter is no longer impressed by a photo-op on an empty flyover. They are counting the hours lost in their week, calculating the fuel burning a hole in their pocket, and worrying about the air their children breathe. They are choosing quality of life. 

The winning manifesto will not list flyovers. It will pledge a statewide transit revolution – a commitment to doubling bus fleets, digitizing payments, and integrating schedules and ticketing so that a seamless multi-modal journey is a reality. It will promise to reclaim street space for people, turning dangerous corridors into complete streets. It will frame mobility not as a civic engineering challenge, but as the backbone of a prosperous, healthy, and efficient Tamil Nadu. 

The world’s most admired cities  have learned that you cannot build your way to prosperity with more concrete. Tamil Nadu has the chance to leapfrog the mistakes of the past and build truly smart, sustainable cities. The question is not whether we can afford to make this shift, but whether we can afford not to. The voter on the crowded bus, the parent worried about polluted air, and the citizen tired of traffic jams are waiting for an answer. And their votes will reflect it. 

Authored by A V Venugopal is a Program Manager at ITDP India, based in Chennai, where he leads sustainable mobility projects focused on street transformation and parking management. His work spans Tamil Nadu and extends nationally, in close collaboration with a multidisciplinary team. 

Filed Under: Chennai, news, Public transport, Walking and cycling Tagged With: Chennai, India, non-motorised transport, Parking, parking management, Public Transport, Safe Route To School, Sustainable Transport, Tamil Nadu, Walking and Cycling

What Indian Cities can Learn From Chennai’s New Mobility Playbook

19th March 2026 by admin

As published in The Times of India

Indian cities do not suffer from a lack of transport plans; they struggle to turn those plans into coordinated action on the ground. Over the past two decades, most large cities have articulated similar ambitions—prioritising public transport, integrating land use and mobility, improving safety, and reducing dependence on private vehicles. Yet congestion has worsened, road fatalities remain high, and private vehicle ownership continues to rise across urban India. The problem has not been a lack of vision, but the difficulty of translating that vision into aligned implementation across agencies. 

Chennai reflects this broader national challenge. The city has planned for mobility before: a Comprehensive Traffic and Transportation Study in 2010 and a Comprehensive Mobility Plan in 2019, both aligned with national policy priorities around public transport, non-motorised travel, and land-use integration. Yet the outcomes fell short. This pattern is familiar across urban India: mobility plans do not fail because their goals are wrong, but because the institutional conditions required to implement them are weak. 

What’s Changed This Time 

For context, Chennai’s latest Comprehensive Mobility Plan (CMP) for 2023–2048 must be understood in this context. It is not the city’s first attempt at mobility planning, nor does it radically depart from earlier goals. 

But the key shift is institutional. With the operationalisation of the Chennai Unified Metropolitan Transport Authority (CUMTA) in 2022, Chennai now has a coordinating body for transport decisions across agencies and jurisdictions—something most Indian cities still lack in practice. Mandated under the CUMTA Act, the preparation of the Comprehensive Mobility Plan is a statutory requirement, marking a move away from ad-hoc planning towards a formally instituted process. This matters because fragmented decision-making, rather than a lack of projects, has fundamentally shaped poor mobility outcomes in Indian cities. 

Planning at the Right Scale, with the Right Evidence 

The CMP reflects the scale at which Chennai’s mobility challenges now operate. While earlier plans were anchored to a smaller planning area—1,189 square kilometres, the current CMP adopts a much broader metropolitan lens, covering 5,904 square kilometres. This expanded boundary brought rapidly urbanising suburban regions into the mobility planning framework, recognising that travel patterns, commuting pressures, and infrastructure demand today extend well beyond the city core and municipal limits. 

Planning at this scale required being backed by a stronger evidence base. The CMP draws on large-scale household surveys covering over 50,000 households and approximately two lakh citizens, complemented by fifteen primary surveys on traffic, parking, road conditions, freight movement, and travel behaviour. This shifts planning away from assumptions and corridor-level fixes towards a clearer understanding of how people travel across the region. 

Additionally, the planning process was participatory from the outset. Multiple government departments responsible for roads, public transport, planning, utilities, and finance, and public stakeholders, were engaged throughout, contributing to problem framing as well as solution design. By involving these agencies and the public from the outset, the CMP seeks to build shared ownership, an essential condition for implementation that earlier mobility plans often lacked. 

Where the Real Test Lies: Governance 

If evidence and participation explain why this CMP is different in its preparation, governance will determine whether it changes outcomes. Across Indian cities, mobility failures arise from projects implemented without alignment—often cancelling out each other’s benefits. Roads are widened while bus fleets stagnate for decades; metro and rail systems are built without reliable last-mile access; and parking supply continues to expand even as public transport struggles for priority. Each decision may appear defensible in isolation, but together they undermine the city’s mobility goals. 

Chennai’s CMP is explicit about this failure—and about what must change. At the centre of this shift is the role envisaged for the CUMTA. Unlike earlier arrangements that relied on goodwill or ad-hoc coordination, CUMTA is positioned as a reviewing authority for transport and mobility proposals initiated by different departments. The intent is straightforward: major transport interventions should proceed only if they align with the metropolitan mobility vision set out in the CMP. 

This is more than a procedural adjustment. It signals a shift in how transport decisions are expected to be made. Cities that have built high-performing urban mobility systems such as London and Singapore—have done so by consolidating authority, standardising dataand design systems, and enforcing alignment across agencies through institutions like Transport for London and the Land Transport Authority. Chennai’s CMP moves in this direction through proposals for standardised right-of-way design, region-wide data systems, parking management as a demand-management tool, and the exploration of a dedicated urban transport fund. 

Early Gains and the Test Ahead

This institutional experiment is already showing signs of traction. As the CMP is being integrated with the city’s Third Master Plan, its priorities are beginning to acquire statutory force through land-use planning. This alignment has the potential to significantly strengthen implementation—anchoring mobility decisions within the city’s formal planning framework and reducing the risk of fragmented or competing interventions. 

That said, it would be premature to treat this as a settled outcome. The durability of this shift will depend on consistent enforcement of alignment, the ability to resolve inter-agency conflicts, and the extent to which the coordinating institution’s role is sustained through administrative practice over time. 

What Could Change on the Ground 

If the CMP holds through implementation, its most visible impact will be a different everyday experience for commuters. Commutes become more predictable. Public transport becomes a reliable first choice rather than a reluctant compromise. Streets acquire clearer priorities, reducing conflict between buses, pedestrians, cyclists, and private vehicles. 

For residents in the metropolitan periphery—where growth has outpaced services—the plan’s metropolitan lens is especially significant. Better alignment of suburban rail, bus services, and regional connectivity with where people live and work can reduce dependence on two-wheelers and long, expensive commutes. Safer, more legible transport systems expand access for women, older adults, and children. Businesses benefit from more reliable labour access and logistics. 

A Test Case for Indian Cities 

Chennai’s CMP does not offer a shortcut, nor does it guarantee success. What it offers is a clearer diagnosis of why mobility planning has struggled in Indian cities—and a credible attempt to address those weaknesses through governance, coordination, and evidence-led decision-making. 

The lesson here is not that cities need better plans. Most cities already have them. The lesson is that without empowered institutions, shared ownership across departments, and mechanisms to enforce alignment, even the most technically sound plans will struggle to change outcomes. Chennai has begun to test that proposition. Other Indian cities would do well to pay attention. 

About the Authors 

I. Jeyakumar, is an retired officer of the Indian Railway Traffic Service (IRTS) from the 1997 batch, has been serving on deputation to the Government of Tamil Nadu as Member Secretary, Chennai Unified Metropolitan Transport Authority (CUMTA) since August 2022. He has been instrumental in building the organization and driving transformative initiatives such as the Comprehensive Mobility Plan, City Logistics Plan, Journey Planner cum QR-based Integrated Ticketing System, Parking Policy and Management for Chennai, Street Design for Safe Commute to School, and several other Multimodal Integration projects.  

Aswathy Dilip is the Managing Director of ITDP India. She is a sought-after expert in raising support for sustainable mobility from key decision-makers, governments, and stakeholders. With support from her team, she works with the National, State, and City governments; providing them with technical assistance on sustainable, inclusive, and equitable urban mobility. Her work has contributed to creating streets safe for walking and cycling, implementing parking reforms, accelerating transition and building support for high-quality, sustainable mass transit. She has a degree as an urban designer from Cardiff University, UK, with a bachelor’s in architecture. 

Filed Under: Chennai, E mobility, Public transport Tagged With: Chennai, India, non-motorised transport, Public Transport, Sustainable Transport, Walking and Cycling

Making Tamil Nadu’s Cities Future-Ready:  Mobility Priorities By 2031

10th March 2026 by admin

Everyone talks about the future like it is all about gadgets and AI, with Robo dogs manning our cities, flying cars helping us cut the traffic at grade, and everything becoming ‘smart’ to save time.  

And while having some of these would actually make the future of cities more exciting and optimised, there is one uncomfortable truth that we can’t ignore: 
If we can’t fix the city’s mobility, by fixing the buses networks and fleet, footpaths, and the city’s air pollution — 2031 won’tfeel futuristic at all! 

And this degenerated version of future is already in play in many of our cities, where while we have summits on AI, the basic transport facilities are still tied to private vehicles and unsafe roads, forcing even the smartest minds feel humbled in front of the infrastructure. 

So, we asked a simple question: 
What does a realistic future-ready Tamil Nadu really look like? 

To answer this, it is crucial to acknowledge that transport is no longer a basic service issue for Tamil Nadu’s (TN) citizensthat simply moves people from point A to point B. It has become an issue of safety, women’s rights, and family livelihood. Increasingly, it has gone even beyond these fundamentals and become a climate issue as well, with the state’s GHG emissions growing by between 2005–2019. In major cities of TN, transport contributes up to one-third of total emissions. 

In this context, the Sustainable Mobility Network (SMN) has developed the Tamil Nadu (TN) Urban Mobility Priorities, 2031, which lists out four priority areas we wish to see addressed. These are built on the principle that safe transport and healthy cities are fundamental rights.  
 
While drafting the priority areas, the attempt was to ensure that these build on the existing schemes like TN road safety policy, TN EV Policy, Chennai parking policy, Chennai climate action plans, and CMPs, and doesn’t require for the state to reinvent the wheel. 

More and Convenient Public Transport for All!

Despite MoHUA’s recommendation of 60 buses per lakh urban population, major cities in TN operate with only 18 buses per lakh, totalling 7,909 buses across the state. To add to this, in Chennai, 50% residents lack access to a bus stop within walking distance inside the Chennai Metropolitan Area.  

Owing to this shortage of buses on the whole, even well-intended schemes like the Vidiyal Payanam scheme, which led to female ridership increasing from approximately 40%to 61.78%, has had a stunted impact. Inadequate fleet strength has led to overcrowding and long wait times for existing users, highlighting the need for more buses. 

What should be prioritised? 

First and foremost, to meet the current demand, at least 15,800 more buses are needed. This is to ensure that there is a ride for every 5-minutes by bus/ public transport in urban areas and a bus stop within 5-minute walking distance for all residents. While buses increase, it is crucial to ensure these new buses are low-floor, wheelchair friendly with ramps, automatic doors and emergency buttons. To further make it futuristic, enabling digital payments for all services, having real time passenger information and ensuring smooth transfer between various modes is crucial. 

Cleaning Up Urban Mobility

The average mode share of private vehicles is 35% in major TN cities; with Chennai Metropolitan Area alone reaching 63,413 private vehicles per lakh population! These are staggering numbers which not only leave the road networks choked with congestion, but also rapidly worsen air quality! Road transport is a major contributor to air pollution, with 4 million high-emissions vehicles in Chennai alone. This causes serious health concerns amongst citizens. 

What should be prioritised? 

When it comes to cleaning up air, every effort matters. 

Both pull and push measures. As pull measures, starting with 100% electrification of vehicles and buses in Chennai could be a start, with 50% target for other five largest cities. To further bolster cleaning up the air, ensuring smooth EV transition in private vehicles is key. For this, having one charger for every 20 EVs is crucial, along with incentivising scrapping vehicles older than 15 years.  

While EVs get promoted, disincentivising polluting vehicles is equally crucial. Here come the push factors. The state should also prioritise having a green tax on polluting vehicles along with implementation of Low Emission Zones in cities with population over 10 lakhs. 

A Pedestrian First Initiative! 

As per an analysis of Accident Data from Tamil Nadu State Transport Authority (TNSTA) and Traffic Police, 2022-2024 by ITDP IndiaIn Chennai and Coimbatore, pedestrians account for 30-50% of all road crash fatalities, highlighting the urgent need for safer streets. A school-going child in Chennai would encounter about 10 obstructions every 100 metres on a footpath, with parking being the leading contributor. The elderly and the differently-abled suffer the most. 

What should be prioritised? 

First and foremost, pedestrian- and cycle-friendly street design guidelines must be formally adopted and embedded into the Tamil Nadu Combined Development and Building Regulations (TNCDBR) and city masterplans. This can be the foundation of all future efforts. Next, all roads must be designed or redesigned in accordance with Indian Roads Congress codes, ensuring at least two-metre-wide, well-lit, continuous footpaths and accessible pedestrian crossings. 

Building on this foundation, speed-calmed zones should be implemented around hospitals, educational institutions, and markets to prioritise safety in high-footfall areas. There should also be a simultaneous focus on a Safe Routes to School programme, with a need to be rolled out in at least 50% of all government schools to protect children’s daily journeys. 

Finally, cities with populations above 10 lakhs must implement comprehensive parking policies and Area Level Parking Management plans to manage demand and reinforce safer, people-first streets. 

Urban Transport Planning to be Holistic and Coordinated!

Despite strong public demand for better buses and safer footpaths, nearly 70% of city budgets in Chennai, Coimbatore, and Erode are spent on flyovers and road development, which are vehicle-centric (as per a study on budgets of the three cities by ITDP India). This contradiction caters to only vehicle users, resulting in transport challenges. 

What should be prioritised? 
 
First, urban laws under the Tamil Nadu Motor Vehicle Rules (TNMVR) must be strengthened to explicitly protect pedestrians, cyclists, and public transport users. 

Next, a state-level Unified Transport Authority and an Urban Transport Fund should be established, along with Gender and Policy Labs in all cities to institutionalise inclusive and evidence-based decision-making. 

With governance structures in place, at least 60% of transport budgets must be allocated to public transport, clean mobility, walking, and cycling. 

All urban projects should then be aligned with city-level Comprehensive Mobility Plans, Road Safety Plans, and Climate Action Plans to ensure coherence and long-term impact. Finally, local public meetings and community audits must be conducted through city mobility forums to ensure transparency, accountability, and continuous citizen engagement. 

Will this future become the reality? 

The future of mobility in TN can’t be limited to a gadget, or an app, or a code. 

The future is whether a child can walk to school safely. 

Whether a woman can board a bus without fear. 

Whether an elderly citizen can cross the street without risking their life. 

Whether a young professional can breathe clean air on their commute. 

And encouragingly, Tamil Nadu is beginning to act on this vision, not just in words, but in budgets. 

In Chennai, a historic Rs 200 crore allocation for Safe Routes to Schools in the 2026 city budget, covering 50 km, marks the first-ever dedicated SRTS budget. This year also marks the second consecutive year of large-scale funding (Rs 250 crore) for walking and cycling infrastructure. The city has further committed Rs 50 crore for 25 km of Non-Motorised Transport corridors, Rs 110 crore for bus terminal redevelopment through PPP, Rs 40 crore for multimodal integration at Washermenpet and Chepauk–Marina, Rs 10 crore for junction improvements, and a citywide Smart Parking Management programme across 20 locations. Institutional reforms, including the strengthened Quality Control and Project Development Department, indicate that implementation capacity is being built alongside vision. 

In Coimbatore, the FY 26–27 budget allocates Rs 60 crore to build 26 km of footpaths by converting storm water drains into usable walkways, which is a transformative shift in reclaiming space for people. This is complemented by Rs 10 crore for Safe Streets on Trichy Road, Rs 5 crore for public EV charging infrastructure at 25 locations, and funding to operationalise the Diwan Bahadur (DB) Road multi-level car park (MLCP), opening opportunities for behaviour change campaigns. 

Alongside MTC’s phased induction of e-buses, the Bus First campaign, and CUMTA’s push for unified mobility guidelines, Tamil Nadu is increasingly aligning policy, funding, and governance structures toward a people-first mobility transition. 

If Tamil Nadu continues on this path – strengthening bus fleets, cleaning the air, prioritising pedestrians, and coordinating institutions, 2031 will not just be futuristic, it will feel equitable, breathable, and safe. 

The opportunity is here. The budgets are beginning to reflect intent. Now the task is to stay the course! 

Inputs from Sanchana S, Tejesvini Ravi, AV Venugopal, Sooraj EM, Bezylal Praysingh and Donita Jose, ITDP India

Filed Under: Chennai, Public transport Tagged With: Chennai, India, non-motorised transport, Public Transport, Sustainable Transport, Walking and Cycling

One Challenge, Five Startups, Better Public Transport for All 

23rd February 2026 by admin

As appeared in the Sustainable Transport Magazine


“Where is my bus?” Ask any Indian commuter, and chances are they have asked this before. The long waits and uncertainty often push people to simply give up and hail a rickshaw. Over time, what should be a city’s most reliable service — public buses — caninstead drive people towards private vehicles. This frustration is not unique to India, and innovation is needed to improve today’s bus systems across the board. 

History shows that significant challenges like this can often be solved by breaking them into more manageable parts. That is how ‘hackathons’ began in the 1990s — computer programmers fixing one glitch at a time until entire systems are improved. The lesson was simple: solve more minor problems first, and the larger system benefits. 

In April 2021, India embarked on a collaborative journey to solve issues with its urban bus systems. The Ministry of Housing and Urban Affairs (MoHUA) and the Smart Cities Mission launched the Transport4All (T4A) Challenge — India’s first and largest digital transport challenge. Co-hosted by ITDP India, with support from the World Bank, Startup India, and CiX, the program brought together over 240,000 citizens, 130 cities, and 28 startups. This collective effort aimed to tackle a single mammoth problem, divided intoseven clearly defined challenges. The outcome? Of the 10 pilot projects born from the Challenge, several are already helping to ease commuters’ daily challenges through digital innovation. 

The Concept and Challenge Design 

The T4A Challenge used a dynamic, three-stage process to bring together cities, citizens, and startups to co-create solutions for public transport.  

Stage 1: Identifying Problems  

The first stage in 2021 involved a comprehensive assessment of the realities on-the-ground. Ninety-nine cities formed a Transport4All Task Force, a multi-stakeholder collective, to guide decision-making. This collective included city bus authorities, traffic police, metro rail operators, and NGOs. Since T4A was a digital innovation challenge driven by data at its core, a massive data collection exercise — the largest of its kind in India — was undertaken. Over 200 NGOs supported a city survey that involved more than 200,000citizens, 17,000 bus drivers and conductors, and 25,000 informal public transport drivers. Their inputs helped shape eight core problem statements. 

Stage 2: Solution Generation  

With the problem statements defined, the Challenge shifted its focus to finding solutions by reaching out to startups in 2022. From over 160 applicants, 45 startups with 70 proposals were shortlisted to develop and refine digital solutions through mentoring and workshops. After another round of screening, the top ten winning startup solutions were selected. They each received a reward of up to ₹20 lakhs (USD $22,000) per solution, along with the chance to proceed to the next stage of implementation. 

Stage 3: Pilot Testing  

This was where theory met practice. In 2023, the winning startups received pilot orders to engage with public bus operators for large-scale testing of their digital solutions. This stage was crucial for refining the solutions based on four mentorship rounds, in which the startups ironed out their selling points, business models, and prototypes. At the end of this stage, eventually, two problem statements were dropped due to a lack of robust solutions. Five startups ultimately took on the following six problem areas:  

  • Route Rationalization 
  • Network Digitization 
  • Bus and Staff Scheduling 
  • Transit Performance Monitoring 
  • Passenger Information and Ticketing 
  • Bus Maintenance Scheduling 

The Impacts and Innovations

Years of effort finally came to fruition when these five startups rolled out their ten pilot projects in six cities — Pune, Pimpri Chinchwad, Mira Bhayandar, Belagavi, Kalyan-Dombivli, and Davanagere. Each pilot started with a simple question that needed to be answered.  

Take bus route planning, for instance. In Pune and Pimpri Chinchwad (two neighboring cities with one public bus operator) and Mira Bhayandar, bus operators asked: “Why can’t bus networks be viewed and planned digitally, instead of being scattered across paper files and Excel sheets?” One startup, Anamar Technologies, digitized 1,100 routes in Pune and Pimpri Chinchwad into General Transit Feed Specification (GTFS) formats, enabling multiple digital solutions for the bus operators at Pune Mahanagar ParivahanMahamandal Limited (PMPML). Meanwhile, the startup Amiraj Wahan did the same in Mira Bhayandar for three routes. Now, staff can update routes in minutes, and passengers can see them directly on Google Maps. 

There has also always been an issue of planning staff and vehicle schedules dynamically based on passenger demand and traffic. Drivers and conductors have long asked: “Why can’t our shifts be planned reasonably and efficiently?” In Belagavi, the startupInnoctive Technologies (CargoFL) introduced a scheduling tool that reduced scheduling time from 1410 minutes to just 120 minutes. In addition to improving scheduling, it also saved up to ₹13 lakh (USD $15,000) per depot annually and increased vehicle utilizationfrom 25 to 80 percent. 

For many city bus operators, another frustration was: “Why don’t we have a dashboard to see how buses are performing?” The startup, Vrishchik Technologies LLP, stated that in Davanagere, they created digital dashboards that track operations with 95% accuracy and generate up to 30 actionable reports on various operational aspects.  

Even bus maintenance was reimagined. Instead of waiting for breakdowns, bus operators asked: “Why can’t repairs be predicted and planned?” QED Analyticals and ApnaWahan piloted predictive maintenance in Pune, using on-board devices and digital platforms. The result: repair turnaround times dropped by 50% from 3 hours to 1.5 hours, and overall costs fell by 16 percent. 

And what about the passengers who often wonder: “Why don’t the buses go through the areas where people actually live and work?” As cities grow, routes get outdated, which means some buses run nearly empty while others are overcrowded. The startup, AmirajWahan Pvt Ltd, helped three cities — Belagavi, Kalyan-Dombivli, and Mira Bhayandar — redesign their networks. In Kalyan-Dombivli alone, 84 routes were rationalized, expanding coverage from 280,000 to 720,000 people.  

Lastly, one issue is persistent for many of India’s modern bus users: “Why can’t bus information be at our fingertips, and why can’t fares go cashless?” In Pune and Mira Bhayandar, Anamar Technologies and Aloha Tech, respectively, launched mobile apps offering live arrival times, multimodal journey planning, and cashless ticketing.  

Going Digital is Now Essential

T4A’s four-year journey, culminating in these ten pilots across six Indian cities, underscores the power of collective action. It shows what is possible when citizens ask the right questions, innovators create freely, mentors guide, and cities open their doors to change. Data and digital tools tied it all together. From dashboards that track fleet performance, to predictive systems that flag maintenance needs, to apps that display live bus information and tickets — these pilots have proven that technology and public transport can work together. They also sent a clear message to India’s 100+ bus operators: going digital is no longer optional, it is essential. 

The next step is to ensure that these solutions do not remain short-lived pilots but become part of daily operations. That means building the capacity within public bus operators and, just as importantly, investing in them in the long term. Innovation needs funding to survive and scale. The T4A Challenge has shown us that it is attainable. Now it is about making it the norm, so that bus riders across India no longer need to keep asking, “Where is my bus?”  

By Donita Jose, ITDP India and Varsha Jeyapandi, ITDP India 

Filed Under: Public transport Tagged With: India, non-motorised transport, Public Transport, Sustainable Transport

Why Tamil Nadu Should Electrify Private Buses via Leasing to Improve Public Transport

9th October 2025 by admin

Conventional bus ownership model vs recommended dry lease model for e-bus

Read time ~7 minutes

Tamil Nadu is one of the few states in India where both public and private bus services have long coexisted as a system that once struck the perfect balance between coverage, affordability, and reliability. This partnership ensured that buses reached deep into neighbourhoods and mofussil routes while keeping fares affordable and services reliable. 

But today, the system finds itself in a catch-22 situation leading to long waits for passengers. Government-run bus services are struggling to keep pace with growing demand and limited fleets, while private operators, are constrained by limited permits and soaring diesel costs, leading to challenges in operations and expansion. The result — commuters have fewer buses to rely on, forcing them to be dependent on personal vehicles leading to worsening air quality and congestion. 

But there is a silver bullet, which can help salvage the situation. 

A new study by ITDP India, Accelerating Sustainability: Electrifying Tamil Nadu’s Private Bus Sector, offers a way out of this deadlock. By electrifying private stage carriage buses through a leasing model, the state could bridge its bus deficit and curb emissions but also help private operators expand profitably, all at once — turning this catch-22 into an opportunity for cleaner, more reliable public transport. 

But how bad is the bus problem in Tamil Nadu to begin with? 

The Bus Shortage Problem 

Buses are the backbone of Tamil Nadu’s urban mobility. There is a total of 28,500 stage carriage buses (private and government operated). These are the buses which run on fixed routes, stop to pick up and drop off passengers, and charge per head. Of these 28,500 stage carriage buses, 30%, i.e 8,600 odd are privately owned. Of these, only 7,500 buses are currently operational on the road every day. 

Relying on these 7,500 odd private buses every single day, are a whopping, 48 lakh passengers! 

What’s worse? There are 63 urban cities in TN with populations over one lakh, but of the 63, only 12 cities operate city-bus services, using a combined fleet of 7,909 buses (public and private).  

To meet current demand of 48 lakh passengers, Tamil Nadu would need at least 15,000 buses—roughly double what’s available (8000 odd).  

Projections for 2030 and 2040 show the gap widening further, making urgent action essential. 

  • By 2030, demand will rise to 20,300 buses across 63 cities. 
  • By 2040, nearly 23,300 buses will be required across 74 cities. 

These numbers show that we need more buses – not necessarily private. That said, private operators are better positioned to step in and bridge this gap, given their already vast fleets provided the right incentives are in place. The latest ITDP India study proposes that this can be taken up in most sustainable way by issuing fresh permits for private buses, with a clause of using just e-buses. 

Why expand through Private Buses? The Case for New Permits 

So, it is clear, urban areas in Tamil Nadu need at least 15,000 additional buses. Expanding the government fleet alone would be slow and costly. By issuing 7,000 new permits, all exclusively for electric buses, Tamil Nadu could see substantial improvements within the next 5 years. Further more, e-buses are not just good for urban air quality but also for exploring innovative financing options. 

It is crucial to note that a major roadblock to this expansion is that no new permits for private stage contract buses have been issued since 1972.    

But electrification can be costly upfront, so how can it be made affordable? 

One of the biggest barriers to electrification is the high upfront cost of e-buses. A leasing model can be allowed in Tamil Nadu to eliminate this challenge, making it easier for private operators to switch to electric buses. 

Leasing will enable operators to access e-buses at lower costs, allowing for faster electrification. The government could also include leasing provisions in new permits, along with financial incentives.  

How this works is that, typically, instead of spending crores to buy an e-bus for upward of ₹ 1 crore, leasing allows the operator to run buses in just ₹ 3-3.5 lakhs every month. In this, only ₹ 1.8-2 lakh will be given to “Fleet Aggregators” or “Rolling Stock Supply Company (ROSCO),” as fixed lease charge. There will be no other additional cost, interest, or EMIs only security deposit which is equivalent of down payment around ₹ 10–12 lakh which is refundable at the end of the lease period. This will make electric buses more lucrative for markets and increase electrification. By transitioning to e-buses, an operator can save at least ₹ 13 lakh per bus annually on rising diesel costs.  

Leasing also ensures higher service quality, as the government can set clear benchmarks for leasers—such as: air-conditioned buses, wheelchair accessibility, National Common Mobility Card (NCMC) compatibility etc. 

Tamil Nadu operates over 7,500 private stage carriage buses serving both cities and mofussil routes. Electrifying this fleet can reduce fuel costs by 30–40% while introducing modern, state-of-the-art buses for our commuters. This transition will strengthen the private sector’s role in delivering sustainable and high-quality mobility.” D.R. Dharmaraj, Secretary, Bus and Car Operators Confederation of India (BOCI) and Secretary, Tamil Nadu Stage Carriage Association. 

Private Operators Support the Shift to E-Buses

To gauge industry response, ITDP India conducted a survey with 250+ private bus operators in Tiruchirappalli, Erode, Cuddalore, Tiruvannamalai, and Dindigul. The findings revealed that 60% of operators are willing to adopt e-buses, provided the government supports them with necessary support like: dry leasing options, lower interest rates, financial aid for electrification, charging infrastructure etc. They stated that they can transition around 1500 old diesel buses to electric in next 3 years.  

A key driver behind this interest is the soaring cost of diesel, which accounts for 60% of total operating expenses for private buses. 

Electrification: A Game Changer for Emissions Reduction 

Beyond transport benefits, electrifying 8,500 private buses could drastically cut Tamil Nadu’s carbon footprint. ITDP India’s analysis estimates that full electrification would: 

  •  Save ₹ 1.6 crore in fuel costs per bus over 12 years; 
  •  Prevent 87.83 lakh tonnes of CO₂ emissions over 12 years, equivalent to planting 39 crore trees; 
  •  Cut daily CO₂ emissions by 2,033 tonnes, accelerating Tamil Nadu’s net-zero targets. 

This transition also aligns with India’s Sustainable Development Goals (SDGs), particularly SDG 7 (Affordable Clean Energy) and SDG 13 (Climate Action). 

Way Forward: Policy Action for a Greener Future 

ITDP India has prepared a detailed report with technical analysis on how to bring in this shift. The report recommends several key steps like- 

1. Regulatory reforms such as recognising the lease model in the stage carriage permit condition, 
2. Establishing leasing framework for e-buses 
3. Establishment of e-bus leasing company 
4. Piloting e-buses across various cities to evaluate energy and operational efficiency. 
5. Expanding charging infrastructure, with special tariff for e-buses.
6. Policy for new permits exclusively for e-Buses  
7.Provide scrappage incentives to operates to scrap old diesel vehicle 

By following such recommendations, Tamil Nadu can ensure that its public transport system which has long thrived on the partnership between state-run and private buses can prosper in years to come, sustainably. Going forward, electrifying private stage carriage buses through innovative leasing models can allow the state, to not only expand bus availability rapidly, but cut emissions, and make services more sustainable and reliable. Supporting private operators to modernise their fleets isn’t just a policy option, it’s a necessary step to future-proof Tamil Nadu’s mobility and air quality. 

If acted upon, this approach could once again position Tamil Nadu as a leader in public transport, where government and private players work hand-in-hand, commuters move without compromise, and the state streets hum with cleaner, quieter, and more efficient e-buses.


Written by Aditya Rane, Senior Associate, Transport Systems and Electric Mobility and Donita Jose, Senior Associate, Communications.

Filed Under: PT InFocus, Public transport, Uncategorised Tagged With: Buses, Carbon Emissions, China, E-BUS, electric mobility, Electrification, EV policy India, Mandates, Private buses, Public Transport, Zero Emission Vehicles

EV Charging Infrastructure in India: What is Slowing Down States?

8th October 2025 by admin


Read time ~8 minutes

India’s streets are buzzing with new EVs — but plugging them to charging isn’t always easy. Charging points are still too few, often hard to find, and sometimes unreliable. While this is a concerning gap, it is also an opportunity to create space for innovation and leadership to boost the number of charging stations. 
 
This is a critical piece in the puzzle as India has set out an ambitious goal of having 30% of all new vehicles sales to be electric by 2030. In order to support this growth, complementary infrastructure support, such as charging infrastructure, is the urgent need of the hour.   

  • Snapshots of growing charging infrastructure in the country
  • Snapshots of growing charging infrastructure in the country
  • Snapshots of growing charging infrastructure in the country
  • Snapshots of growing charging infrastructure in the country

Current scenario and progress made so far 

A recent report by CareEdge Ratings, puts the growth and the challenges in perspective. The report found that between FY22 to early FY25, there have been a surge from approximately 5,151 public charging stations to 26,367 public charging stations in India. This marks a 72 per cent Compound Annual Growth Rate (CAGR) in a three-year period. 
 
However, the reports also contextualises how this growth isn’t exactly sufficient. The same, CareEdge report highlights that despite this accelerated growth, there is still just one public charging station per 235 EVs, which can be quite an unpleasant experience for the users with long wait times and range anxiety. 

This makes it clear that the charging ecosystem, while growing, is still lagging behind the pace of EV adoption. But why this delay? 

The bottlenecks 

From identifying available land parcels, to site selections, to approvals, state and cities have to tackle many challenges in order to create a suitable environment for the private charge point operators to set up charging stations. Unless a basic record of land available, feasible sites, grid preparedness, low electric establishment costs, etc is created, having charging stations come up at scale is a challenge. Many of these steps are interconnected and difficult to tackle- 

  1. Identifying Land parcels- One of the foremost challenges for states is finding suitable land, especially for public charging stations. In most Indian cities, land is controlled by multiple government bodies—municipal corporations, revenue departments, schools, transport undertakings, etc. For this, there is need for the nodal agency to coordinate among all and find parcels for establishing infrastructure. Even if there is a nodal agency to coordinate this, it is often the Chief Secretary’s office, which has the powers and authority to seek such information. However, land-owning agencies may not prioritise allocation of land for EV charging, due to a lack of awareness or competing priorities.
  2. Selecting the right locations- Even when land parcels are identified, determining where to place charging stations requires careful feasibility studies. National guidelines recommend having at least one charging station within every 1 km × 1 km grid in urban areas and one every 20 km on highways.  These locations have to be carefully identified keeping in mind a combination of factors like land use, traffic flow patterns, building density, vehicle population, popular hotspots etc. But often times, such data is readily unavailable and constantly evolving making it a challenge for states to empirically choose sites. In reality, states are depending on three types of feasibility studies- Operational feasibility studies, financial feasibility studies, and technical feasibility. In terms of operational feasibility- aspects like whether there are any active drain lines/water bodies etc are taken into account and in technical viability aspects like availability of sufficient electricity supply are looked into. At the same time in financial viability, how soon the charging station can break even is examined.  
  3. Coordination with Land Owning Agencies – In most Indian states, land-owning agencies lack effective tools to estimate the revenue potential of a charging station on their land. As a result, they often show little interest in allocating key land parcels or investing in basic electricity infrastructure. This undermines the concept of a plug-and-play model. In such cases, CPOs (Charging Point Operators) must take on the responsibility of establishing upstream infrastructure themselves, leading to additional delays and more complex implementation steps.  
  4. Creating a financially viable ecosystem: A big challenge for states in growing EV charging is making it a viable business for Charge Point Operators (CPOs). Right now, the high cost of setting up power connections and the high electricity tariffs make it hard for CPOs to recover their investment. Unless states reduce these power connection costs and make tariffs more reasonable, private players will hesitate to invest, slowing down the expansion of charging stations. 
  5. Ensuring electricity girds can support the plan– It has been observed in Indian cities that there is a lack of regional EV load assumptions, which further limits planning at the state and DISCOM levels. Without these, states could hit roadblocks eventually. This information is crucial as existing grids may be able to support EV load, but not for a future demand. Eventually, the DISCOM’s need to plan for the growing demand especially in charging hubs and highway corridors where high speed charging will be utilised for implementing infrastructure upgrades and grid readiness. 
  6. Data and monitoring– To tie together all efforts and ensure they are well monitored to make improvements in future, tracking is crucial. Not only should states track location and counts of charger, but also utilisation and performance, so building an EV Dashboard is critical, which is yet another task for the states to take up.
  7. Lack of quality gird infrastructure along highways- This is one of the reasons, the DISCOMS find it difficult to electrify highways for EV Charging. 

Why states matter 
The above mentioned bottlenecks are all for the states and cities to tackle, making them the crucial anvils around which EV ecosystems are to be built.  Most states have appointed Nodal agencies or EV cells to take up this list of exhaustive tasks, however things have been slow. 

National programmes like FAME, CESL’s initiatives, and the PM e-Drive scheme are helping set the stage. For instance, PM e-Drive, launched in 2024, allocates ₹2,000 crore to roll out 72,000 fast chargers nationwide, with subsidies covering up to 100% of upstream infrastructure costs such as transformers, cabling, and installation. It also covers the charging equipment cost. 

But these schemes don’t directly extend support to state governments in taking on any preparatory work. The scheme reduces capital costs for operators, but the real enabling conditions — land allocation, fast-tracked approvals, reduction in electricity tariff, and local matchmaking platforms — must come from states.   

How Front-Runner States Have Been Doing It 

1. Tackling Land Availability 

 Delhi has addressed land bottlenecks by offering concessional land rates for charging and swapping stations, while also mapping high-utilisation sites to minimise delays that usually arise from dealing with multiple land-owning agencies. Singapore has taken a similar approach by leveraging public housing (HDB) car parks, where it floated large-scale tenders that added 22,600 charging points across 1,964 sites. Both cases highlight how proactive land allocation can rapidly expand charging networks. 

2. Making Charging Affordable 

 Singapore has reduced the cost of charging by providing up to 50% rebates for chargers in public car parks and private residences, making it easier for both operators and users to transition. Delhi has complemented this by introducing one of the lowest EV tariffs in the country, which brings down operational costs for charge point operators (CPOs) and supports wider affordability. 

3. Streamlining Coordination 

Delhi has created a State Charging Infrastructure Committee (SCIC) headed by the Vice Chairman of the Dialogue and Development Commission (DDC). This committee brings together government agencies, utilities, and energy operators under one roof, ensuring that approvals and decisions are not held up by fragmented responsibilities. 

4. Ensuring Financial Viability for CPOs 

 To improve financial returns, Delhi has offered capital subsidies for charger installation and provided 100% SGST reimbursements on advanced batteries. These measures reduce upfront costs for operators while encouraging investment. Similarly, Karnataka and Singapore have worked with utilities and private partners to expand charging coverage, ensuring that financial viability is not left entirely to the market. 

5. Developing Green Corridors 

 Karnataka has gone beyond city-level interventions by developing charging stations along high-demand travel routes such as the Bangalore–Mysore Expressway and the Bangalore–Chennai Highway. This has ensured that intercity EV travel becomes more practical, reducing range anxiety for users. 

More such case studies of frontrunner cities and states like Delhi, Karnataka, Singapore can be found here in the Status Report for Public Charging Infrastructure in Tamil Nadu. 

What Next? Unlocking the Next Wave of EV Charging
Ambitious policies have shown what’s possible, but in most states the rollout of charging infrastructure is still slow and fragmented. The way forward lies in making it easier for Charge Point Operators (CPOs) to invest and expand. Single-window clearances can cut red tape, digital platforms can match land with operators and track progress, state incentives can complement central schemes, and joint EV load planning with DISCOMs can prepare the grid for rising demand. By taking these steps, states can move from scattered efforts to a coordinated ecosystem that makes EV charging viable, scalable, and future-ready. 


Written by Donita Jose, Senior Associate, Communications, with inputs from Bezylal Praysingh, Senior Associate, Transport Systems and Electric Mobility and Sooraj EM, Deputy Manager, Transport Systems and Electric Mobility

Filed Under: E mobility, PT InFocus, Public transport Tagged With: Carbon Emissions, Charging infrastructure, Chennai, Delhi, electric mobility, Electrification, EV policy India, Public charging stations, Zero Emission Vehicles

What do the new proposed CAFE norms for Heavy Duty Vehicles Mean for Buses?

3rd October 2025 by admin

~ 6 minutes read time


Here’s a number we cannot ignore – heavy vehicles make up just 4% of all vehicles on Indian roads, yet they are responsible for nearly 60% of transport-related emissions. That one number alone shows why the newly announced Fuel Efficiency norms – Corporate Average Fuel Efficiency (CAFE) norms, by Bureau of Energy Efficiency (BEE) are so critical. 

First introduced in 2017, these were originally just fuel efficiency norms requiring all BS-VI heavy-duty vehicles (HDVs) (HDVs are vehicles above 12 tonnes) to meet minimum fuel efficiency levels based on their model’s requirement  when tested at 40 km/h and 60 km/h. These were known as Minimum Energy Performance Standards (MEPS). 

Building on this, BEE is now planning to tighten the regime further and is moving into the second stage. A new draft released on 28 July 2025 proposes taking fuel efficiency norms into Phase 2, where in model specific fuel efficiency norms will be replaced by CAFE norms. The proposed implementation window is from 2027 to 2032. 

What really makes Phase 2 stand out is also the introduction of Super Credits—a mechanism designed to reward cleaner zero-emission vehicles. 

Before diving into these details of proposed Phase 2, let’s step back and understand the basics: what exactly are CAFE norms? 

CAFE norms is a type of fuel-efficiency norm levied on manufacturers of all vehicles like cars, buses, and trucks. Under this, they have to improve the efficiency of the entire fleet they manufacture by a certain percentage by improving the engines of the vehicles. Instead of judging each model separately for fuel efficiency, regulators look at the average efficiency of an entire fleet produced by a manufacturer. This means that instead of judging each model separately, regulators look at the average efficiency of an entire fleet produced by a manufacturer.   

What is proposed now in Phase 2 for fuel efficiency of HDVs?

  1. Shift from per-vehicle Minimum Energy Performance (MEP) to fleet-wide CAFE standard: Previously, every type /mode of vehicle had different efficiency requirement. But the new proposal says, efficiency targets need to be met on an average across all models sold by the manufacturer cumulatively.  
  2. Stricter target: OEMs will now have to ensure 30% fleet-wide improvement in fuel efficiency compared to 2022–23 levels. Earlier fuel efficiency varied by models.  
  3. Scope expanded: Covers light, medium, and heavy duty vehicles, across all fuels and not just diesel which was the case until now. Previously, it covered only medium and heavy-duty vehicles. 
  4. Super-credits introduced: under this concept, for every Hydrogen and EV vehicle sold, the manufacturer gets a certain number of credits, which are considered equivalent to fuel efficient vehicles sold. For instance:
    • Sale of One Fuel Cell Electric Vehicles (FCEVs) also known as Hydrogen vehicles = ×4 Credits  
      Each of these four credits will be considered as selling 4 fuel-efficient buses while calculating fleet-average compliance. 
    • Sale of One Battery Electric Vehicles (BEVs): ×3credits- ×2 credits (diminishing multiplier over the years) 
      This means that if OEM sells 1 BEV bus initially, it will get 3 credits, which will be initially counted as selling 3 fuel efficient vehicles, and later as 2 fuel efficient vehicles giving bonus weightage to accelerate electrification in the early years. 

This gives bonus credit for each clean bus (EV or hydrogen) sold, making it easier for OEMs to meet compliance targets. For operators like the various state transport undertakings, this will eventually translate into more availability and choice of zero-emission buses in the market. For BEE, it ensures that fuel efficiency norms also linked to electrification. 

Why are these norms important in the context of India’s buses and trucks? 

  1. Targets all types of trucks and buses: All types of fuels be it t diesel or CNG will be covered under the new norms. 
  2. Cuts CO2 emission: Though these two categories of vehicles have a small share, they have a big impact on emissions. That is, though they are only ~4% of all vehicles they contribute nearly 60% of transport CO₂ emissions. 
  3. Fuel = biggest operating cost: STUs and private operators spend 50–60% of their budgets on fuel. Improving efficiency directly reduces costs. 
  4. Energy security: Cutting diesel and CNG use reduces oil imports, saving national resources and reducing exposure to global fuel price shocks. 

What does 30% better fuel efficiency mean for buses? 

ITDP India based on available data, calculated what the 30% better fuel efficiency will mean for buses. Following are the findings:   

1. City bus (diesel) – These are the most common type of bus operations in cities. Assuming a single city bus operates 250km/day, following is the savings it will bring in with fuel efficiency improved:

Efficiency improvement: A fuel-efficient bus can cover 4.55km in one litre fuel as compared to 3.5km on a normal bus. 
Fuel saved: ~6,000 litres/year/bus 
Cost saved on fuel: ~₹5.7 lakh/year/bus (based on fuel rates in September 2025) 
Emission reduction: ~16 tonnes CO₂/year/bus 

2. Mofussil / Intercity bus (diesel)- Assuming these buses operate 400km per day, following is the kind of saving it will bring in if fuel efficiency improved: 

Efficiency improvement: A fuel-efficient bus can cover 5.85km in 1 litre fuel as compared to 4km/litre on normal bus 
Fuel saved: ~7,500 litres/year/bus 
Cost saved on fuel: ~₹7.1 lakh/year/bus (based on fuel rates in September 2025) 
Emission reduction: ~20 tonnes CO₂/year/bus  

3. City bus (CNG)- Assuming these CNG city buses operate 250km.day, following are the saving they will bring in fuel efficiency. 

Efficiency improvement: A fuel efficient bus can cover 3.9km on one kg of CNG as compared to 3 km/kg on a normal bus. 
Fuel saved: ~7,000 kg/year 
Cost saved on fuel: ~₹6.5 lakh/year (based on CNG rates in September 2025) 
Emission reduction: ~13 tonnes CO₂/year  

Impacts & Benefits for Buses at large 

  1. Medium-duty buses (M2): These are the 7-9 meter long buses. Making them fuel efficient will require, moderate-high effort which may drive OEMs to withdraw inefficient models. 
  2. City-transit buses (M3): These are the regular 12m buses and used widely across major cities. Since making them fuel efficient would be challenge two outcomes are possible: 
  3. OEMs would strongly prefer electrification to meet targets over, achieving 30% efficiency. Hence, manufacturers of these will need both efficiency upgrades + partial electrification to comply. 
  4. ~30% reduction in emissions and air pollution in urban areas. 
  5. Affordability: Fuel efficiency + electrification make bus services less vulnerable to fossil fuel price shocks. 

National-scale impact

On an avg. 80,000 new ICE buses registered every year. If these norms apply on all 80,000 of them, the benefits are massive: 

  • Fuel savings: ~42 crore litres of diesel + 11 crore kg of CNG saved annually. 
  • Cost savings: ~₹50,000 crore per year across operators. 
  • Emission reduction: ~13.4 lakh tonnes CO₂ avoided annually. 

Why should State Transport Undertakings and bus operators support? 

  • Direct cost savings: Each bus saves ₹6–7 lakh/year. For large fleets, this is hundreds of crores. 
  • Cleaner fleets: Major reduction in CO₂, NOx, and PM → healthier cities, as buses contribute around 40% total emissions in passenger vehicle category.  

Written and researched by Aditya Rane S- Senior Associate, Transport Systems and Electric Mobility
Edited by Donita Jose, Senior Associate, Communications

Filed Under: PT InFocus, Public transport, Uncategorised Tagged With: Buses, Carbon Emissions, China, E-BUS, electric mobility, Electrification, EV policy India, Mandates, Private buses, Public Transport, Zero Emission Vehicles

Chennai Hops on the E-bus Trend, Marks Tamil Nadu’s Clean Transport Leap 

2nd July 2025 by admin


Read time- 6 minutes

Chennai is on the brink of a clean mobility revolution. The Tamil Nadu Chief Minister, MK Stalin inaugurated over 120 electric buses on June 30—marking the city’s first major deployment of zero-emission buses. This will be the first time that the city bus operator- Metropolitan Transport Corporation (MTC) will operate e-buses! These 120 e-buses, all being non-AC, have been rolled out as part of a larger plan to electrify the fleet, with total of 625 buses expected to be introduced later this year in Phase 1. In Phase 2, which is slated for next year, another 600 are expected, taking the total to 1250 e-buses.

For a metropolis that moves lakhs of people daily, this is not just a fleet upgrade, it is a powerful signal that Tamil Nadu is serious about decarbonising transport and building climate-resilient cities. 

Transport: A Key Lever in Tamil Nadu’s Climate Action 

One of the key reasons why this move to go electric is a milestone for the state, is that transport is one of the growing contributors to greenhouse gases in rapidly urbanising state of Tamil Nadu. As per data from the recent report Tamil Nadu’s Greenhouse Gas Inventory and Pathways for Net-Zero Transition, GHG emissions from the transport sector in Tamil Nadu almost tripled between 2005 and 2019, from 10 million tonnes of carbon dioxide equivalent (MtCO2Eq) to 27 MtCO2Eq. The report also found that the share of transport sector emissions in the overall emissions has grown from 12% to 19% in the same period.  

The situation is likely to have not improved post 2019 as well, as data from the official Vahan dashboard shows that EV adoption is still in the nascent stages in Tamil Nadu.  

This slow uptake makes electrifying state-operated public transport fleets an important and high-leverage opportunity. With direct control over these fleets, the government has led by example. This one move has also enabled the broader EV ecosystem, including charging infrastructure, maintenance networks, and local manufacturing, to scale up! 

How things will pan out from July onwards

MTC currently operates 3420 buses in the Chennai Metropolitan Region. As per estimates from other Indian cities, each bus running on diesel, emits tail pipe carbon emissions to the tune of 755 gm CO2 per kilometre. While public buses still generate lower emissions per passenger-kilometre compared to private vehicles like cars and two-wheelers, the absolute emissions from diesel buses remain detrimental to the environment, especially considering the daily operations of thousands of kilometres. 

As per MTC’s current plans, the incoming e-buses will be introduced in phases. Initially these e-buses will be new additions to the fleet and will not be replacing the diesel buses. This will help in expanding the service of MTC to more parts of the city.  

By doing so, MTC will nudge more people to choose public transport over personnel vehicles. This shift will help bring down not just tail-pipe emissions from private vehicles but also ease the everyday issue of traffic congestion. After all, a single bus that carries about 50 passengers can replace nearly 30 cars on the road. What’s more, buses take up less than 2% of the total road length, but serve over 30–40% of all urban commuters. So, every new bus added to the fleet doesn’t just clean up the air—it also frees up road space, making the city move better and breathe easier. 

Additionally, MTC is exploring retrofitting older diesel buses with Compressed Natural Gas (CNG) technology. This parallel move will further lower tailpipe emissions from the remaining conventional fleet, ensuring that even non-electric buses contribute to a cleaner urban environment. 

In subsequent phases, these electric buses will begin replacing ageing diesel buses, leading to a gradual but sustained reduction in the carbon emission intensity of Chennai’s public transport system. This strategy balances both immediate service expansion and long-term decarbonisation.  

Funding Support Electric Buses 
KfW 500
World Bank- GCC based buses for MTC  625
World Bank- GCC based buses for MTC 600
KfW Phase 3 750
KfW Phase 4 650
KfW Phase 5 100
Table 1: Total no. Of electric buses expected to arrive in Tamil Nadu over next few years and their sources of funding. Source: TN Transport Department Policy Note 2025-26 

From Policy to Practice: Tamil Nadu Walks the Talk

In 2023, Tamil Nadu launched its updated EV policy, setting a clear goal, to make at least 30% of all buses run by State Transport Undertakings (STUs) electric by 2030.

The policy has stated that ‘The STUs run a large share of public buses in Tamil Nadu. The government will switch to electric buses in a phased manner and aim to make 30% of the fleet electric by 2030’

The current rollout of e-buses is a direct reflection of this commitment. With a total fleet of 20,508 buses across eight STUs, including MTC, the State Express Transport Corporation (SETC), and Tamil Nadu State Transport Corporation (TNSTC) divisions in Coimbatore, Madurai, Tirunelveli and others, the state would need to procure over 6,100 electric buses in the next five years to meet this goal.

While this target is ambitious, the state is already making decisive moves. Tamil Nadu has begun procurement of total of 2500+ e-buses through World Bank-supported Gross Cost Contract (GCC) models and KfW funding. Officials have also indicated that based on lessons from this initial tranche, the state will continue expanding the fleet by 500 to 750 buses annually. This steady, phased approach allows the state to scale up capacity on e-bus operations, while building on operational experience.

Beyond its state goals, this effort also contributes meaningfully to India’s national EV30@30 ambition, which aims to electrify 40% of all buses by 2030.

But in 2024–25, only 3% of all new buses sold in the country were electric. That’s just 3,400 e-buses, compared to more than one lakh diesel buses. In this situation, every effort, including that of Tamil Nadu is a step in the right direction.

Along with buying new buses, the state is also investing in depots and charging stations. This ensures the system is ready to support the growing e-bus fleet.

Through it all, ITDP India has been providing technical support to the state, helping shape procurement plans and training programmes. With the right support and strong leadership, Tamil Nadu is building a path that other states can follow to make public transport clean, efficient, and future-ready. 


Written by Donita Jose, Senior Associate, Communications, with inputs from Sooraj EM, Deputy Manager, Transport Systems and Electric Mobility

Edited by Aangi Shah, Senior Associate, Communications

Filed Under: PT InFocus, Public transport, Uncategorised Tagged With: Buses, Carbon Emissions, China, E-BUS, electric mobility, Electrification, EV policy India, Mandates, Private buses, Public Transport, Zero Emission Vehicles

PMPML’s Journey Through Time: How Pune and Pimpri Chinchwad Got Better Public Transport

21st April 2025 by admin


Every single day, nearly 11 lakh citizens rely on Pune Mahanagar Parivahan Mahamandal Limited (PMPML) buses to move across Pune and Pimpri Chinchwad. For a service that’s just under 20 years old, this is no small feat. Despite fierce competition from private vehicles, the occasional pushback against dedicated bus lanes, PMPML has managed to carve out its space as a reliable, sustainable transport option. 

Picture this: today, a Pune resident can board a PMPML bus, ride an electric bus on a dedicated BRTS lane, and pay a fraction of what other modes would cost. Few Indian cities can claim such progress. But this hasn’t happened overnight—over the last two decades, a series of strategic moves have strengthened PMPML’s presence, shaping Pune’s public transport network into what it is today. 

However, the very gains that took years to build now face the risk of being undone. The city’s rapid growth demands more buses, better services, and continued investment—without which, PMPML’s ability to serve Pune’s people will weaken. 

So, what were the key milestones in PMPML’s journey? Let’s dive in. 

Here’s a look at this journey: 

2007: PMPML Formed with BRTS 

PMPML was formed in 2007 through the amalgamation of Pune Municipal Transport (PMT) and Pimpri Chinchwad Municipal Transport (PCMT), which previously operated as separate public transportation entities for Pune and Pimpri-Chinchwad, respectively. Pune and Pimpri-Chinchwad are sister cities with growing urban populations and expanding boundaries. This geographical proximity led to a significant overlap in bus routes and services offered by PMT and PCMT, often causing operational inefficiencies and commuter inconvenience. To address these challenges, PMPML was established as a unified public transport body to serve both cities as well as nearby towns and villages. 

The formation of PMPML was further strengthened with streamlining the BRTS operations. Implementation of the Pune BRTS began in 2006, with Pune being the first city in the nation to adopt BRTS. The project was implemented on pilot stretches from Katraj to Swargate and Swargate to Hadapsar. The project was partially funded under JnNURM, which also led to development of footpaths and cycle tracks as part of the mandates for the funding. ITDP supported Pune Municipal Corporation (PMC) and Pimpri Chinchwad Municipal Corporation (PCMC) with the design of the BRTS corridors, as well as by creating awareness about the advantages of BRTS. 

2015: Rainbow BRTS expands to more routes

After the success of BRTS in initial pilot routes, additional corridors were inaugurated in 2015. These were the Yerwada-Wagholi and Sangamwadi-Vishrantwadi in Pune, and Sanvi Phata-Kiwale and Nashik Phata-Wakad for Pimpri Chinchwad inaugurated in 2015.

ITDP was involved as a technical partner, guiding PMC and PCMC with refinements in the overall system, leading to consolidation of these corridors under the ‘Rainbow BRTS’ brand. This strategic branding created a unified identity for BRT services across the metropolitan region. 

Rainbow BRTS since has been ahead of the curve as it introduced advanced features, including dedicated BRTS stations with automatic gates, GPS-enabled bus tracking (AVLS), level boarding, passenger information systems, off-board ticketing, and speed tables for pedestrian crossings. PMPML also established a state-of-the-art Transport Command and Control Centre to monitor performance and service levels. Today, the Rainbow BRTS network spans slightly over 60 kms. Its hybrid operational model enabled buses to bypass traffic congestion along dedicated trunk routes while maintaining route flexibility across non-BRTS corridors.

Aerial view of the Phule Nagar Station and Rainbow Bus on the Sangamwadi-Vishrantwadi Corridor (Source: Rainbow Bus, PMPML)

2018

Pioneer in Electric Buses

The next big milestone for PMPML was scripted in the year 2018 when PMPML further enhanced its service with the introduction of electric buses, setting a benchmark for sustainable urban mobility in India.  
They were able to do this with financial support from the Pune Smart City Development Corporation who enabled the procurement of 150 e-buses, making Pune the city with one of highest number of e-buses in India back in 2018. This achievement was particularly noteworthy, as PMPML was not among the various transport undertakings selected under the FAME-I scheme. However, the experience gained paved the way for PMPML to secure financial support for 450 additional electric buses under the FAME-II scheme in 2019. ITDP has been actively assisting PMPML by providing technical support as required for the procurement of electric buses. 

As it is well established now, e-buses are significantly more energy-efficient than Internal Combustion Engine (ICE) buses, with a 12-meter e-bus consuming just 1.3 kWh per km, compared to 2.82 kWh/km for diesel buses and 2.89 kWh/km for CNG buses. This makes electric buses nearly twice as fuel-efficient as their diesel and CNG counterparts. 

In addition to efficiency, e-buses have matched the performance of CNG buses while recording fewer canceled kilometers. A passenger survey revealed that 75% preferred commuting on e-buses due to their superior ride quality, air conditioning, and reduced noise levels. Owing to these factors, PMPML is the only State Transport Undertaking (STU) offering air-conditioned services at standard fares. Since the operating cost of AC e-buses is lower than that of AC CNG buses, PMPML has been able to pass these cost savings on to its passengers. PMPML charges a fare of Rs 5 per km for both non-AC and AC buses. In comparison BEST which provides city buses services in Mumbai has a 20% higher fare for AC buses. (Rs 5 per km for non-AC Buses and Rs 6 per km for AC Buses. The daily passes also vary in fares, with Rs 50 and Rs 60 for non-AC and AC Buses, respectively.

Comparison of Energy Consumption between Electric, CNG, and Diesel Buses

One of the First STU to embrace Gross Cost Contract as way forward 

Speeding up the electrification of fleet was adoption of Gross Cost Contract model by PMPML. The STU did so as a key component of its electric bus procurement strategy. Under this model, PMPML pays operators on a per-kilometer basis, while the operators provide buses, drivers, charging infrastructure, and maintenance. This arrangement shifts financial and operational risks away from PMPML, facilitating the rapid adoption of electric buses without significant capital expenditure. Pune’s pioneering implementation of the GCC model accelerated its transition to electric mobility and served as a reference for other Indian cities.  Furthermore, PMPML continues refining its GCC framework, integrating lessons from past experiences.

2022: Integration with Metro 

PMPML hosted a Foundation Week from 18th to 23rd April 2022, celebrating 15 years of its service. In the months following the Foundation Week, both Pune and Pimpri Chinchwad saw the introduction of Metro services. PMPML has since been actively collaborating with Maha Metro to integrate their services and enhance accessibility for citizens. BRTS stops along the Metro corridor were relocated near Metro stations, aligning with the exit points to facilitate seamless transfers for passengers between the two services. Additionally, PMPML introduced feeder routes to Metro stations to expand the Metro catchment area, further improving access. Information panels were installed at Metro stations to help passengers easily identify and use the feeder services.  In fact it continues to support the citizens of Pune region as an analysis by ITDP India on how the Nigdi-Dapodi BRTS corridor and Pune Metro services, compliment each other’s service found that, despite presence of Metro, the Nigdi-Dapodi BRTS corridor serves 1.5 lakh passengers daily, with 37 buses per hour during peak times, one bus every 1.6 minutes. About 47% of users were students (18-25 years).

Vallabh Nagar BRT Station relocated closer to the Sant Tukaram Nagar Metro Station exit for easier access to passengers.

2024: All-in-One Transit App for Commuting and Seamless Ticketing Across any Public Transport mode 

PMPML has consistently demonstrated a proactive approach to improving its services by collaborating with various agencies and stakeholders. One such collaboration which reaped productive results was through the Transport4All (T4A) challenge. As part of this, PMPML supported startups in developing innovative solutions for modern day challenges which state transport undertakings face. Pune nurtured and piloted three successful solutions, one of which led to the creation of the Apli PMPML app. Building on the multi-modal integration, this app offers digital services to PMPML users, including live tracking, ticket booking, route planning, and more. It also integrates with Maha Metro’s online booking portal, advancing the digital integration of Pune’s public transport system. The Apli PMPML App marks a significant achievement for PMPML considering the popularity and positive reviews of the app, hinting its successful implementation. The same is backed by the staggering 10 Lakh+ downloads of the app in a span of only 6-7 months. 

The Apli PMPML app includes live tracking, ticket booking, bus schedules, and more features

Way forward

Pune and Pimpri Chinchwad have consistently proven themselves as leaders in public and sustainable transportation, setting a benchmark for cities across India. But as these cities grow, so too must their public transport systems. Maintaining ridership alone is no longer sufficient—the goal must be to significantly grow ridership. This calls for scaling up the fleet, upgrading service quality, and ensuring that capacity matches the region’s growing demand. 

To truly meet the mobility needs of the future, operational efficiency must improve, and the passenger experience must be reimagined—with greater comfort, convenience, and safety at its core. Public transport must evolve from being merely a mode of mobility to becoming a seamless, enjoyable part of daily life for all residents. 

As of 2025, in an industry-first, PMPML is set to incorporate qualitative benchmarks into its tendering process—prioritising service quality, operational efficiency, and commuter satisfaction. This strategic shift aims to elevate the passenger experience and reflects PMPML’s growing commitment to excellence. ITDP’s collaborative support has contributed to this evolution, providing technical insights and guidance throughout the journey. 

Having supported PMPML since its early stages, ITDP remains a committed partner in this transformation—working together to deliver innovations and strategies that will help Pune Metropolitan Region emerge as one of the world’s most efficient, accessible, and environmentally responsible public transport systems. 
As PMPML enters its third decade, can it keep up with Pune’s and Pimpri Chinchwad’s growing demands—and bring more people back to public transport? Stay tuned for the next part. 


Written by Jagdish Temkar, Associate, Transport Systems, ITDP India
With Technical Inputs from Aditya Rane, Senior Associate – Transport Systems and Electric Mobility, ITDP India
Edited by Donita Jose, Senior Associate, Communication and Development, ITDP India

Filed Under: Public transport, Pune, Uncategorised Tagged With: Electric bus, electric mobility, India, Maharashtra, MORTH, MSRTC, nutp, Public Transport, Rural bus, Sustainable Transport, Sustainable Transport Policy

  • 1
  • 2
  • Next Page »
  • Who We Are
    • Our Team
    • Contact Us
    • Opportunities
    • Our Approach
  • What We Do
    • Complete Streets and Parking Management
    • Public Transport
    • Transit Oriented Development
    • Inclusive Mobility
  • Where We Work
    • Agra
    • Ahmedabad
    • MAHARASHTRA
    • Pune – Pimpri-Chinchwad
    • Nashik
    • TAMIL NADU
    • Chennai
    • Coimbatore
    • JHARKHAND
    • Ranchi
    • NATIONAL
  • News
  • Resources
  • Get Involved
    • Donate

Copyright © 2026 · ITDP Responsive on Genesis Framework · WordPress · Log in

Loading Comments...