As published in The Times of India
Indian cities do not suffer from a lack of transport plans; they struggle to turn those plans into coordinated action on the ground. Over the past two decades, most large cities have articulated similar ambitions—prioritising public transport, integrating land use and mobility, improving safety, and reducing dependence on private vehicles. Yet congestion has worsened, road fatalities remain high, and private vehicle ownership continues to rise across urban India. The problem has not been a lack of vision, but the difficulty of translating that vision into aligned implementation across agencies.
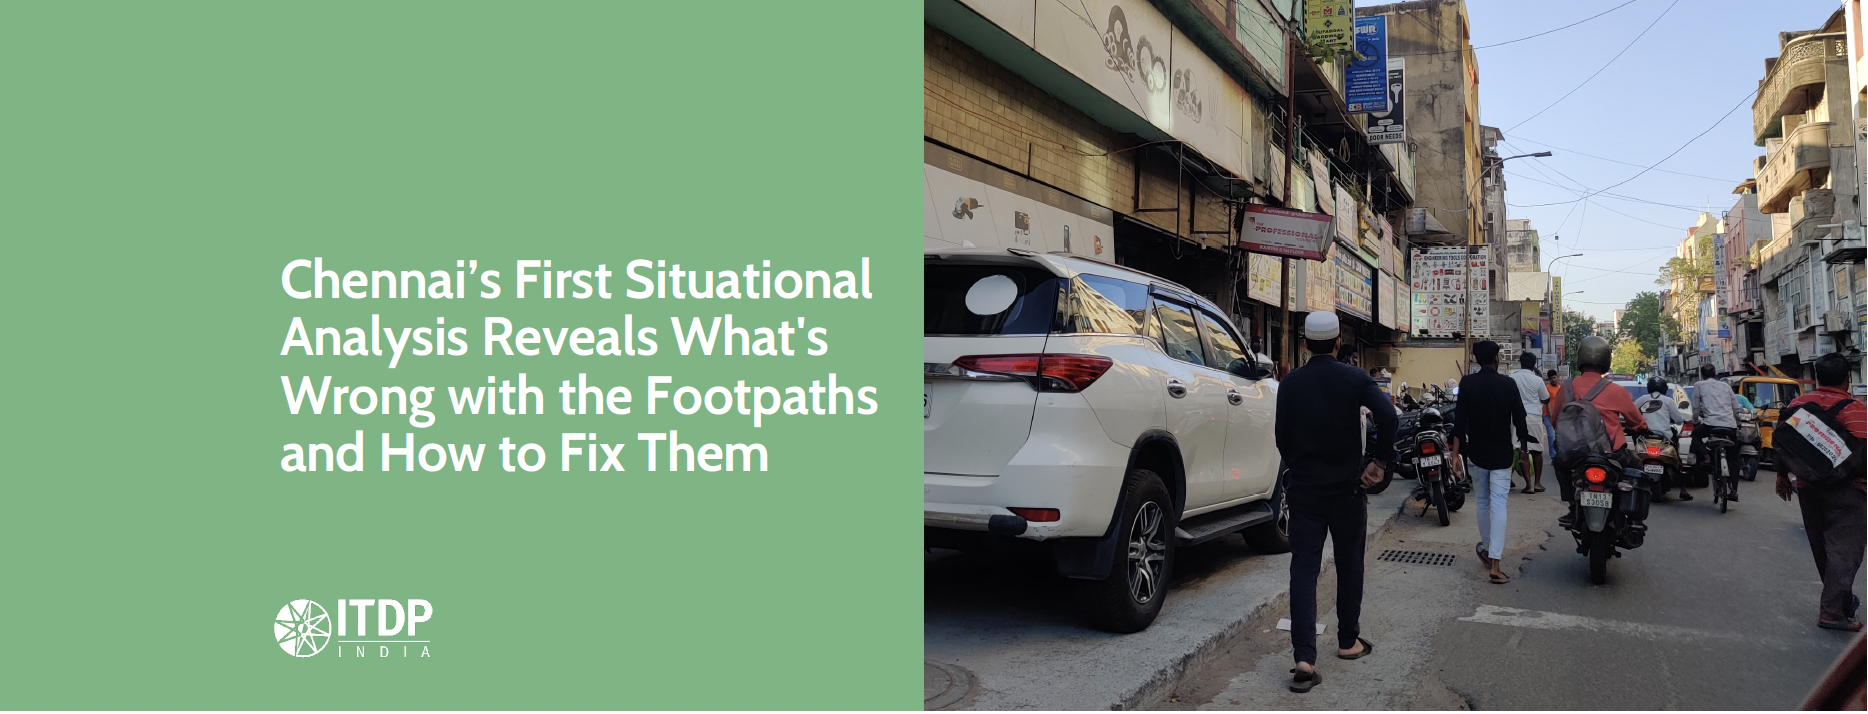
Chennai reflects this broader national challenge. The city has planned for mobility before: a Comprehensive Traffic and Transportation Study in 2010 and a Comprehensive Mobility Plan in 2019, both aligned with national policy priorities around public transport, non-motorised travel, and land-use integration. Yet the outcomes fell short. This pattern is familiar across urban India: mobility plans do not fail because their goals are wrong, but because the institutional conditions required to implement them are weak.
What’s Changed This Time
For context, Chennai’s latest Comprehensive Mobility Plan (CMP) for 2023–2048 must be understood in this context. It is not the city’s first attempt at mobility planning, nor does it radically depart from earlier goals.
But the key shift is institutional. With the operationalisation of the Chennai Unified Metropolitan Transport Authority (CUMTA) in 2022, Chennai now has a coordinating body for transport decisions across agencies and jurisdictions—something most Indian cities still lack in practice. Mandated under the CUMTA Act, the preparation of the Comprehensive Mobility Plan is a statutory requirement, marking a move away from ad-hoc planning towards a formally instituted process. This matters because fragmented decision-making, rather than a lack of projects, has fundamentally shaped poor mobility outcomes in Indian cities.
Planning at the Right Scale, with the Right Evidence
The CMP reflects the scale at which Chennai’s mobility challenges now operate. While earlier plans were anchored to a smaller planning area—1,189 square kilometres, the current CMP adopts a much broader metropolitan lens, covering 5,904 square kilometres. This expanded boundary brought rapidly urbanising suburban regions into the mobility planning framework, recognising that travel patterns, commuting pressures, and infrastructure demand today extend well beyond the city core and municipal limits.
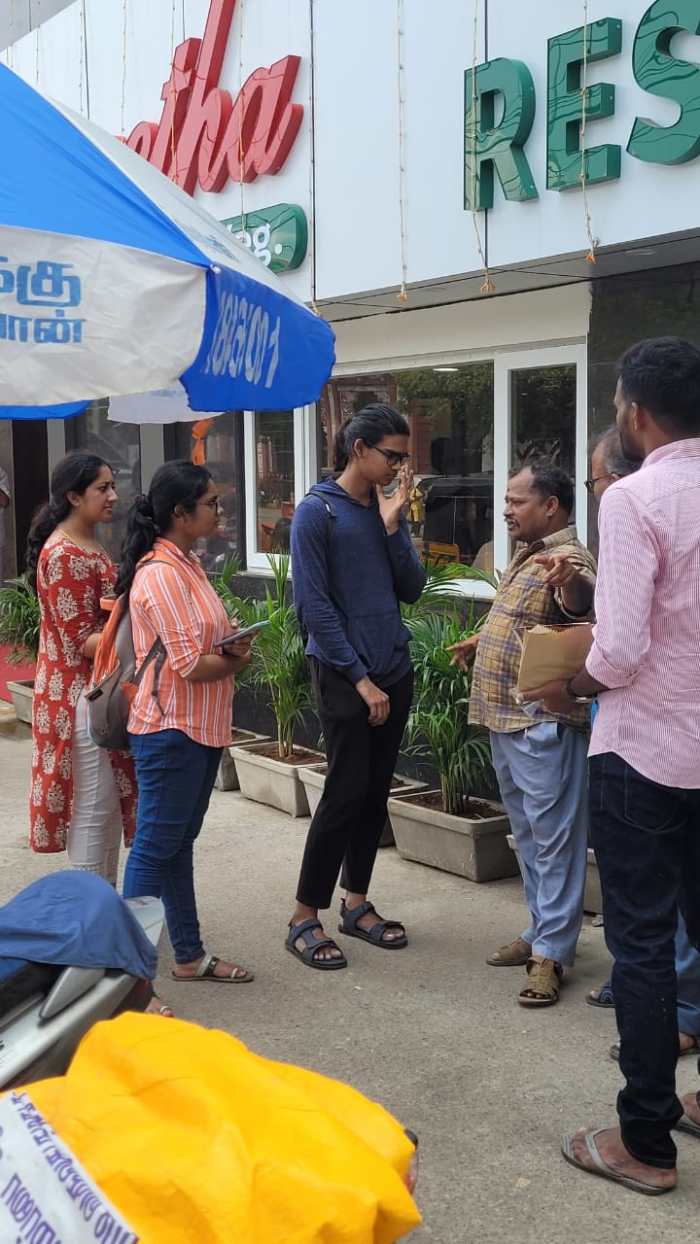
Planning at this scale required being backed by a stronger evidence base. The CMP draws on large-scale household surveys covering over 50,000 households and approximately two lakh citizens, complemented by fifteen primary surveys on traffic, parking, road conditions, freight movement, and travel behaviour. This shifts planning away from assumptions and corridor-level fixes towards a clearer understanding of how people travel across the region.
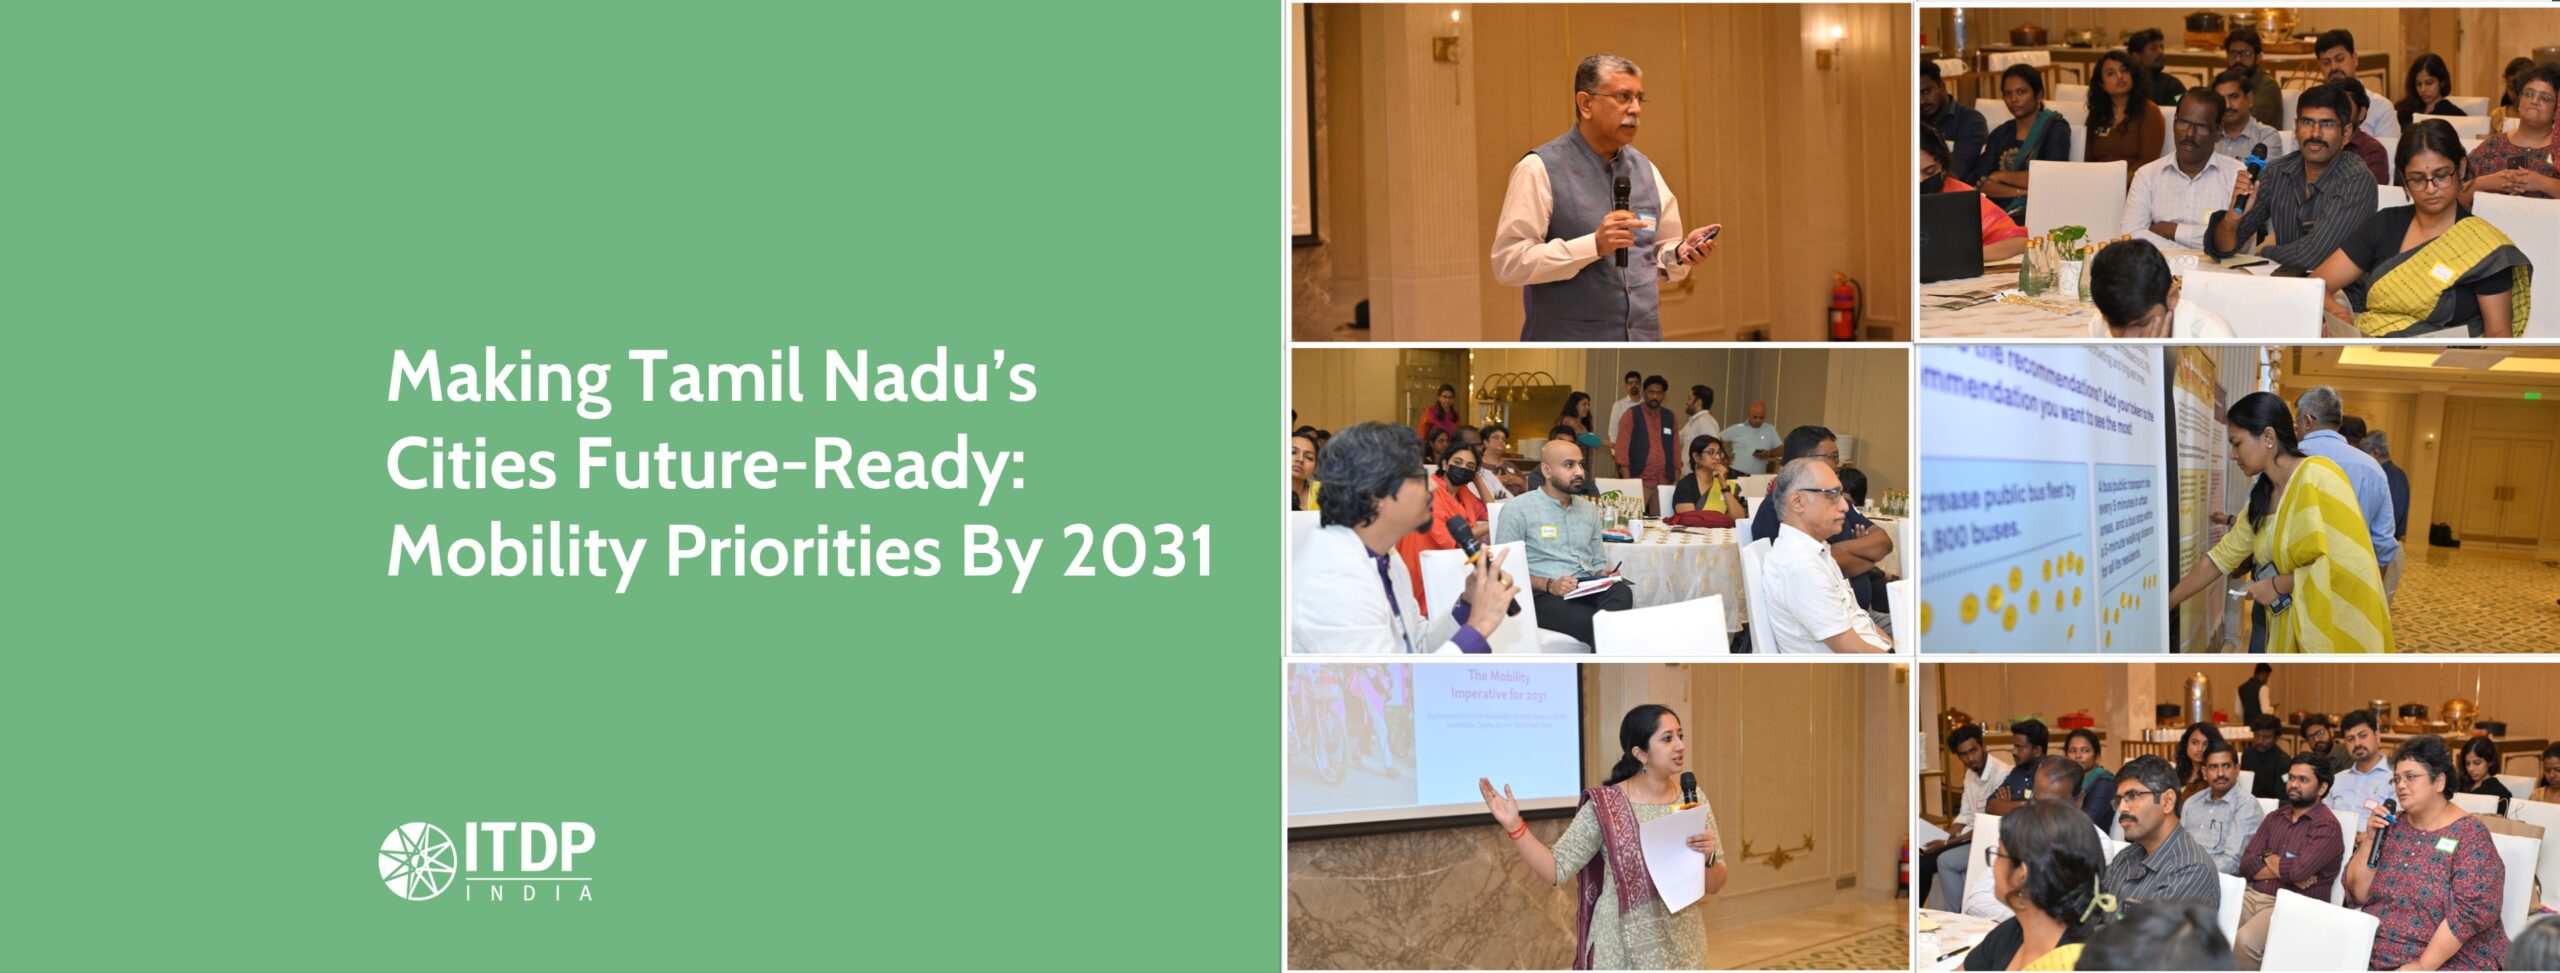
Additionally, the planning process was participatory from the outset. Multiple government departments responsible for roads, public transport, planning, utilities, and finance, and public stakeholders, were engaged throughout, contributing to problem framing as well as solution design. By involving these agencies and the public from the outset, the CMP seeks to build shared ownership, an essential condition for implementation that earlier mobility plans often lacked.
Where the Real Test Lies: Governance
If evidence and participation explain why this CMP is different in its preparation, governance will determine whether it changes outcomes. Across Indian cities, mobility failures arise from projects implemented without alignment—often cancelling out each other’s benefits. Roads are widened while bus fleets stagnate for decades; metro and rail systems are built without reliable last-mile access; and parking supply continues to expand even as public transport struggles for priority. Each decision may appear defensible in isolation, but together they undermine the city’s mobility goals.
Chennai’s CMP is explicit about this failure—and about what must change. At the centre of this shift is the role envisaged for the CUMTA. Unlike earlier arrangements that relied on goodwill or ad-hoc coordination, CUMTA is positioned as a reviewing authority for transport and mobility proposals initiated by different departments. The intent is straightforward: major transport interventions should proceed only if they align with the metropolitan mobility vision set out in the CMP.
This is more than a procedural adjustment. It signals a shift in how transport decisions are expected to be made. Cities that have built high-performing urban mobility systems such as London and Singapore—have done so by consolidating authority, standardising dataand design systems, and enforcing alignment across agencies through institutions like Transport for London and the Land Transport Authority. Chennai’s CMP moves in this direction through proposals for standardised right-of-way design, region-wide data systems, parking management as a demand-management tool, and the exploration of a dedicated urban transport fund.
Early Gains and the Test Ahead
This institutional experiment is already showing signs of traction. As the CMP is being integrated with the city’s Third Master Plan, its priorities are beginning to acquire statutory force through land-use planning. This alignment has the potential to significantly strengthen implementation—anchoring mobility decisions within the city’s formal planning framework and reducing the risk of fragmented or competing interventions.
That said, it would be premature to treat this as a settled outcome. The durability of this shift will depend on consistent enforcement of alignment, the ability to resolve inter-agency conflicts, and the extent to which the coordinating institution’s role is sustained through administrative practice over time.
What Could Change on the Ground
If the CMP holds through implementation, its most visible impact will be a different everyday experience for commuters. Commutes become more predictable. Public transport becomes a reliable first choice rather than a reluctant compromise. Streets acquire clearer priorities, reducing conflict between buses, pedestrians, cyclists, and private vehicles.
For residents in the metropolitan periphery—where growth has outpaced services—the plan’s metropolitan lens is especially significant. Better alignment of suburban rail, bus services, and regional connectivity with where people live and work can reduce dependence on two-wheelers and long, expensive commutes. Safer, more legible transport systems expand access for women, older adults, and children. Businesses benefit from more reliable labour access and logistics.
A Test Case for Indian Cities
Chennai’s CMP does not offer a shortcut, nor does it guarantee success. What it offers is a clearer diagnosis of why mobility planning has struggled in Indian cities—and a credible attempt to address those weaknesses through governance, coordination, and evidence-led decision-making.
The lesson here is not that cities need better plans. Most cities already have them. The lesson is that without empowered institutions, shared ownership across departments, and mechanisms to enforce alignment, even the most technically sound plans will struggle to change outcomes. Chennai has begun to test that proposition. Other Indian cities would do well to pay attention.
About the Authors
I. Jeyakumar, is an retired officer of the Indian Railway Traffic Service (IRTS) from the 1997 batch, has been serving on deputation to the Government of Tamil Nadu as Member Secretary, Chennai Unified Metropolitan Transport Authority (CUMTA) since August 2022. He has been instrumental in building the organization and driving transformative initiatives such as the Comprehensive Mobility Plan, City Logistics Plan, Journey Planner cum QR-based Integrated Ticketing System, Parking Policy and Management for Chennai, Street Design for Safe Commute to School, and several other Multimodal Integration projects.
Aswathy Dilip is the Managing Director of ITDP India. She is a sought-after expert in raising support for sustainable mobility from key decision-makers, governments, and stakeholders. With support from her team, she works with the National, State, and City governments; providing them with technical assistance on sustainable, inclusive, and equitable urban mobility. Her work has contributed to creating streets safe for walking and cycling, implementing parking reforms, accelerating transition and building support for high-quality, sustainable mass transit. She has a degree as an urban designer from Cardiff University, UK, with a bachelor’s in architecture.